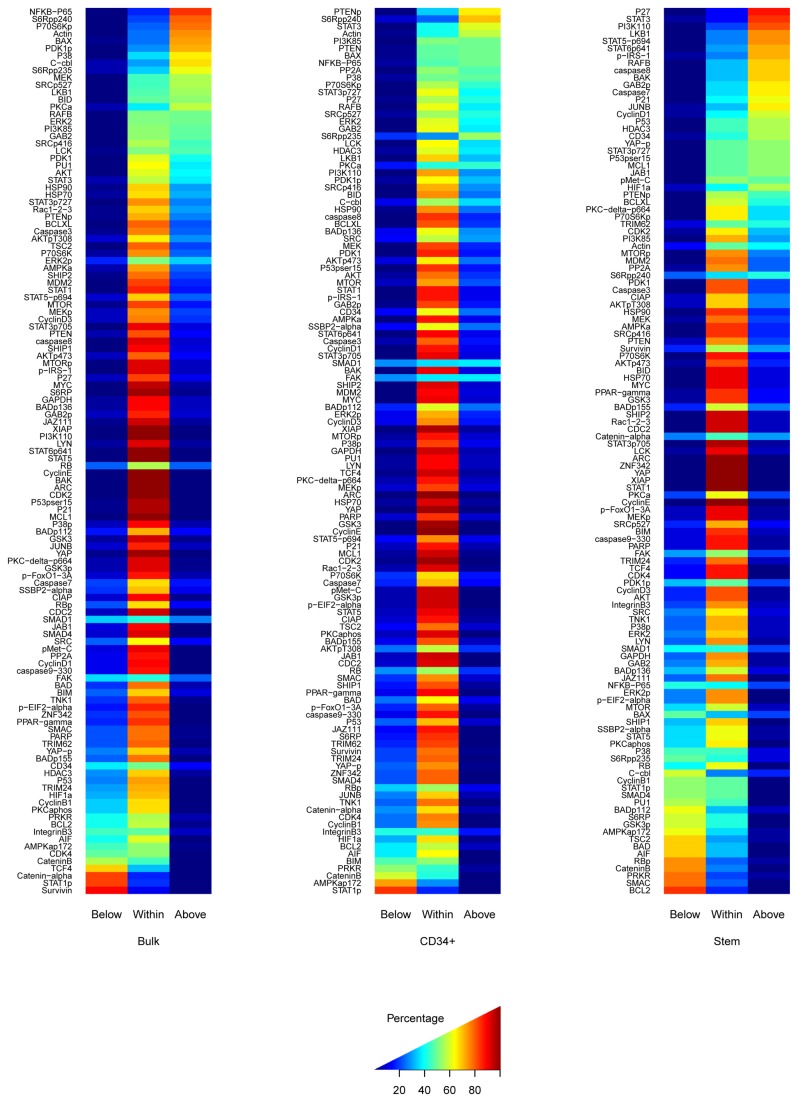
Figure 4. Comparison of expression in Bulk, CD34+ and LSC to that of normal CD34+ bone marrow cells.
The percentage of BULK (Left), CD34+ (middle) or CD34+CD38- cells (right) samples that were below, within, or above the range defined by normal CD34+ cells is shown. Proteins are ranked so that those with the highest (lowest) expression relative to the normal CD34+are at the top (bottom).

