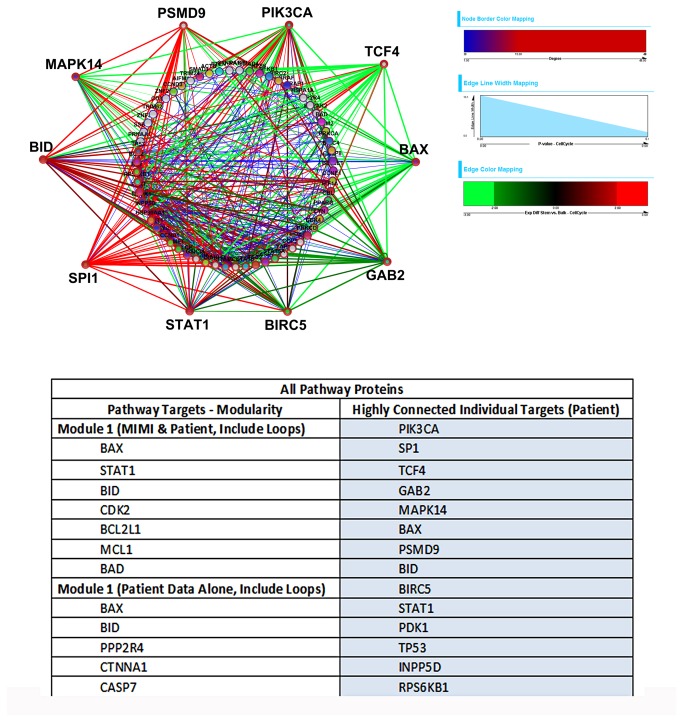
Figure 7. Global networks identified.
The overall network of the most highly differentially expressed protein pairs between CD38+CD38- vs. Bulk cells (p-value ≤ 10-10) based on the entire dataset is shown. The green to red edges represent relative expression levels from the RPPA data, and show connectivity predicted by the t-test protein pair comparisons between CD34+CD38- vs. Bulk cells; to interpret the edge colors, please see Figure S3 in File S1 which displays the ordering of the protein pair ratios depicted in this network. Edge width corresponds to relative p-values, with wider edges having lower p-values. Blue edges indicate PPI and signaling interactions from public databases. Node border color and width correspond to the number of protein connections. Individual groups based on protein function are shown separately in Figure S4 in File S1, Subnetworks of highly interconnected proteins found from modularity analysis are listed and the associated proteins with the greatest connectivity (≥ 15 connections) are listed in the accompanying table including those identified by online datasets (left) and those from patient data from this dataset (right). A legend for the node colors, which correspond to known signaling pathways associated with the proteins from available public databases, is included as Table S6 in File S1.

