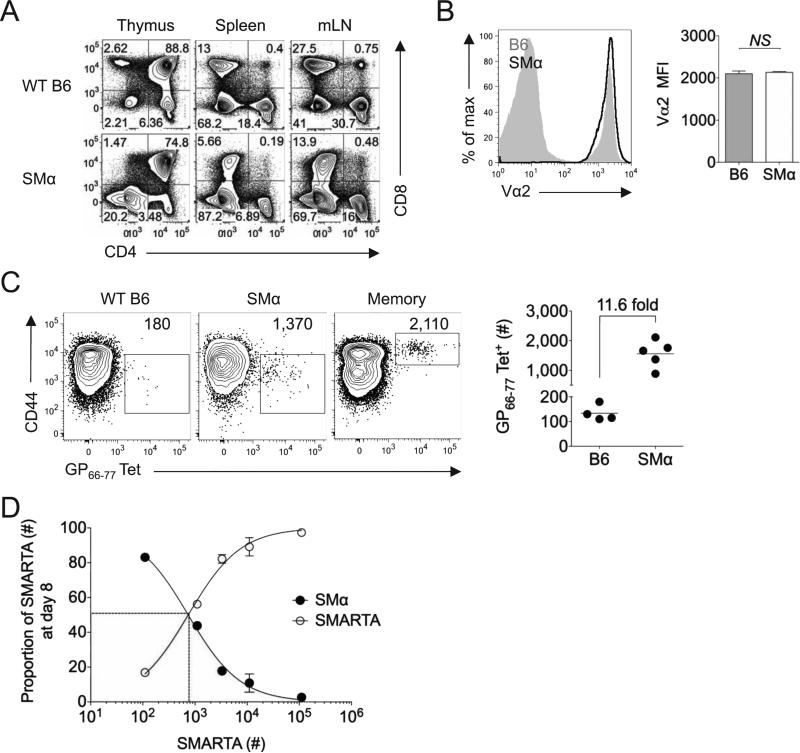
Figure 1.
SMα mice generate a readily detectable population of polyclonal naïve precursors specific for LCMV GP61-80. A) Representative flow plots indicate the frequency of CD4+ and CD8+ T cells in the spleen, mesenteric lymph nodes and thymus of B6 and SMα mice. B) Representative flow plot shows TCR surface expression (Vα2+) in B6 or SMα mice. Bar graph indicates the Vα2 MFI of Vα2+CD4+ cells in the spleens of B6 or SMα mice (n=4/group). C) Representative flow plots show tetramer staining after magnetic enrichment of tetramer-binding cells in B6, SMα or B6 immune (>6 weeks post-infection with LCMV) mice, with numbers indicating the estimated number of tetramer-binding cells per spleen after internal normalization to “spiked” Thy1.1+ SMARTA cells. (1 × 10³) Graph indicates the estimated frequency of tetramer-binding CD4+ T cells in individual mouse spleens and the estimated fold difference in precursor frequency between B6 and SMα mice. D) SMARTA cells were adoptively transferred in various numbers into SMα mice, followed one day later by LCMV infection. Plot indicates the relative proportion of SMα and SMARTA responders at day 8 post-infection, compared to the estimated SMARTA precursor frequency in the spleen at day 0 (estimated as 10% take of the initial transfer). Error bars indicate the standard error of the mean (SEM)(n=4 mice/group). Results are representative of two independent experiments. See also Figure S1.

