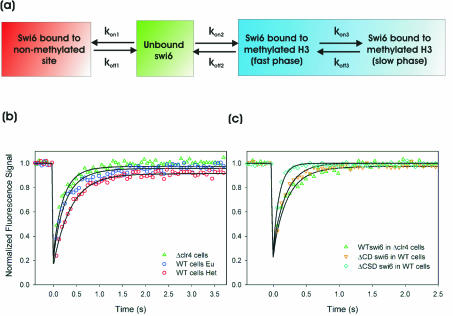
FIG. 5.
Kinetic model and corresponding fits to experimental data. (a) Minimal kinetic model for simultaneously fitting Swi6 FRAP data in clr4-S5 cells and in euchromatin and heterochromatin of a WT strain. kon and koff are association and dissociation rate constants, respectively (see Fig. S2 in the supplemental material for a full model). (b) Best fits, determined by least-squares regression analysis, to the model for WT Swi6 recovery in clr4-S5 cells and WT cells in euchromatin and heterochromatin. All parameters are listed in Table 1. Note that all rate constants are the same for each curve, the observed differences being attributed to the difference in the number of methylated binding sites. (c) Best fits determined by least-squares regression analysis for the CD and CSD deletion mutant proteins. For Swi6ΔCD, all rate constants describing binding to methylated H3 (kon2, koff2, kon3, and koff3) are set to zero. For Swi6ΔCSD a single set of rate constants (koff2 and kon2) describing binding to methylated H3 was sufficient for an accurate fit. All parameters are listed in Table 1.

