
Figure 6.
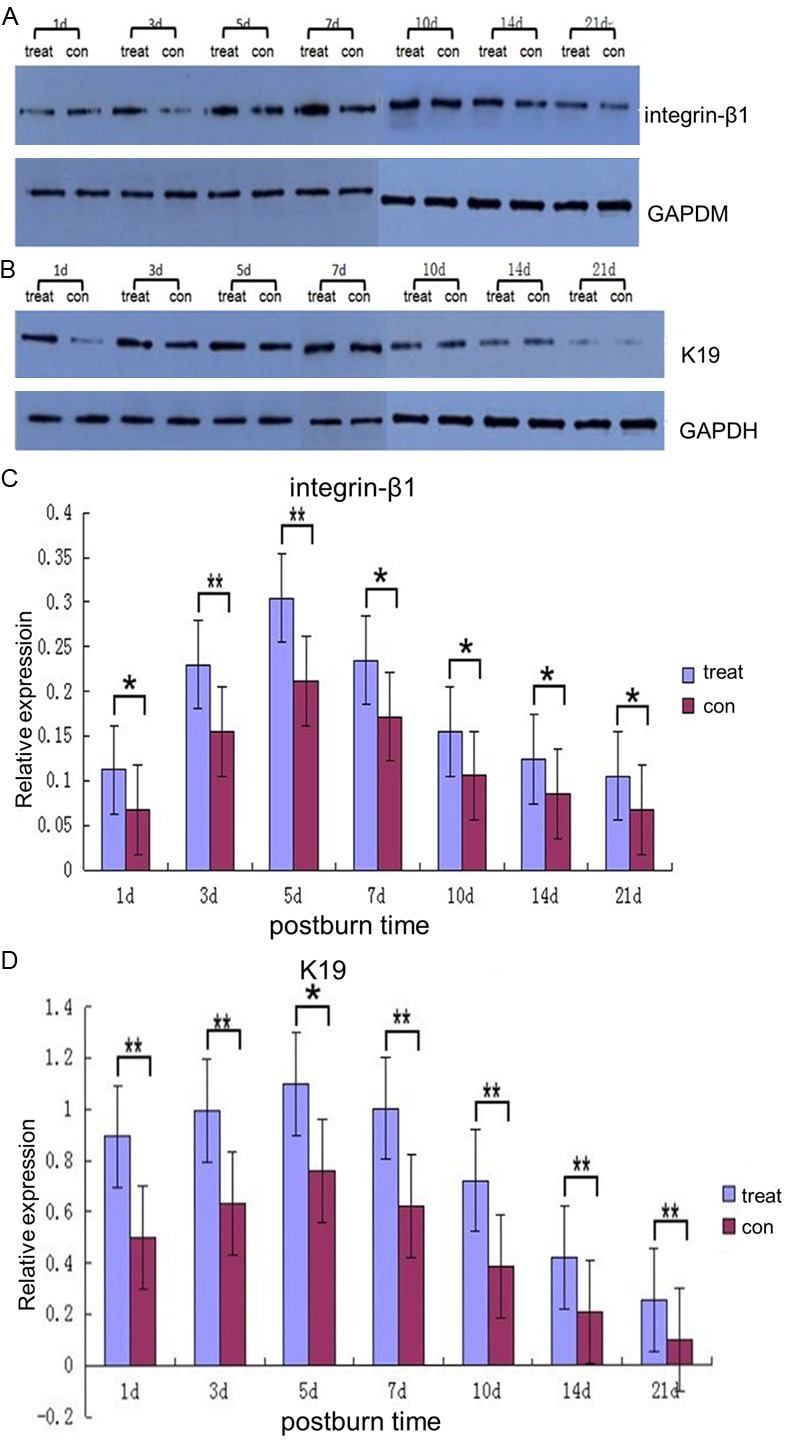
Western blot analysis for integrin-β1 and K19. A, B: Representative chemiluminescence images of blotted membranes containing protein extracts of two groups. C, D: Quantitative analysis of integrin-β1 and K19 levels. Graphs depict mean K19 and integrin-β1 density differences ± SEM of the experimental group compared to the contrast group. Star color indicates statistical significance of difference between two groups (*P < 0.05, **P < 0.01).