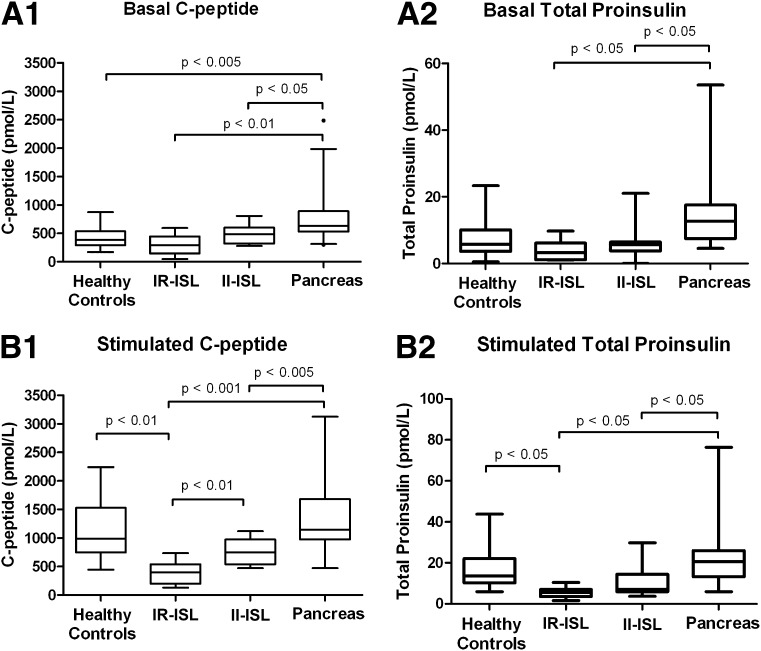
Figure 2.
A: Box plots of basal C-peptide and total proinsulin levels in healthy control group, IR-ISL group, II-ISR group, and pancreas group before arginine injection (basal values). B: Box plots of stimulated C-peptide and total proinsulin levels in healthy control group, IR-ISL group, II-ISL group, and pancreas group during peak stimulation after arginine injection (stimulated values). Data are expressed as median (solid line), interquartile range (box), and range (whiskers).

