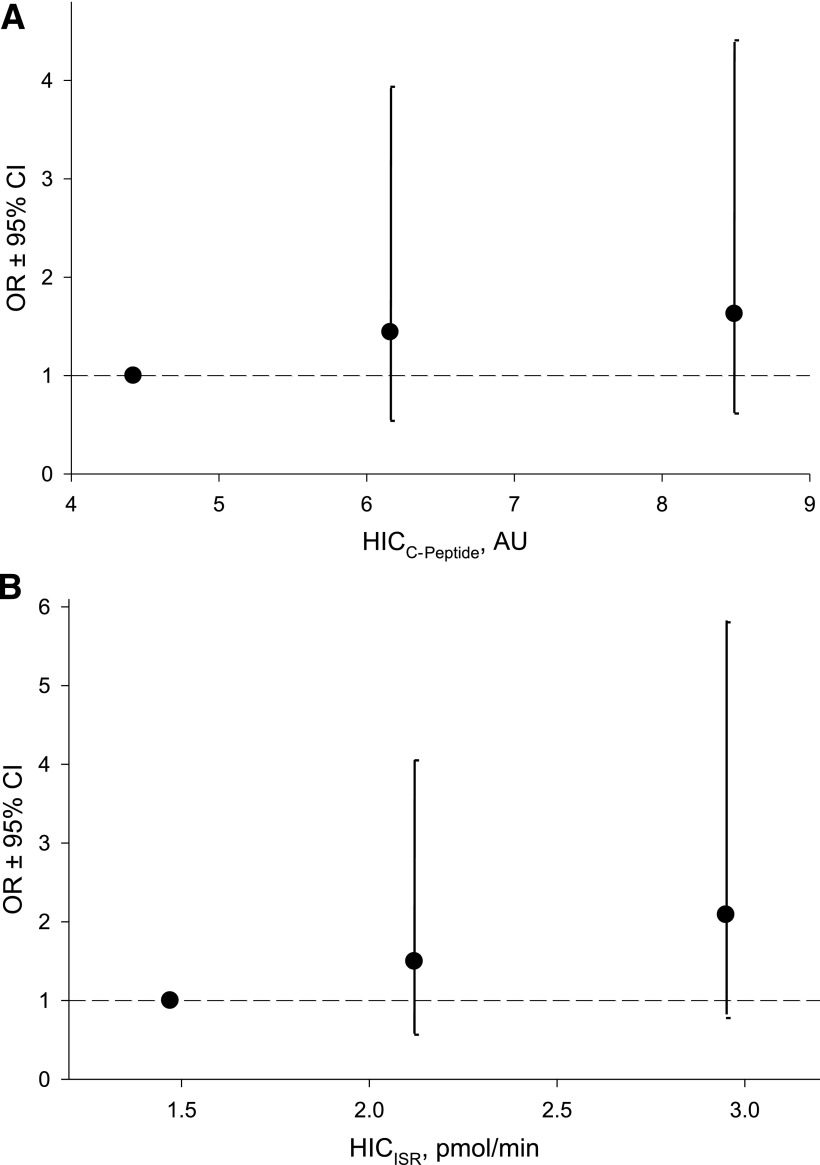
Figure 2.
Risk of subsequent metabolic syndrome according to the respective median of ascending tertiles of two HIC indices. A: HIC calculated by C-peptide values. B: HIC calculated with use of ISR. Adjustment for age, sex, body weight, waist circumference, 1st-phase insulin secretion, and follow-up time. Error bars represent 95% CIs. The horizontal line at 1.0 represents the reference line. Participants were divided into tertiles, according to HIC values. Tertile cut points were determined from the combined group of case and control subjects.

