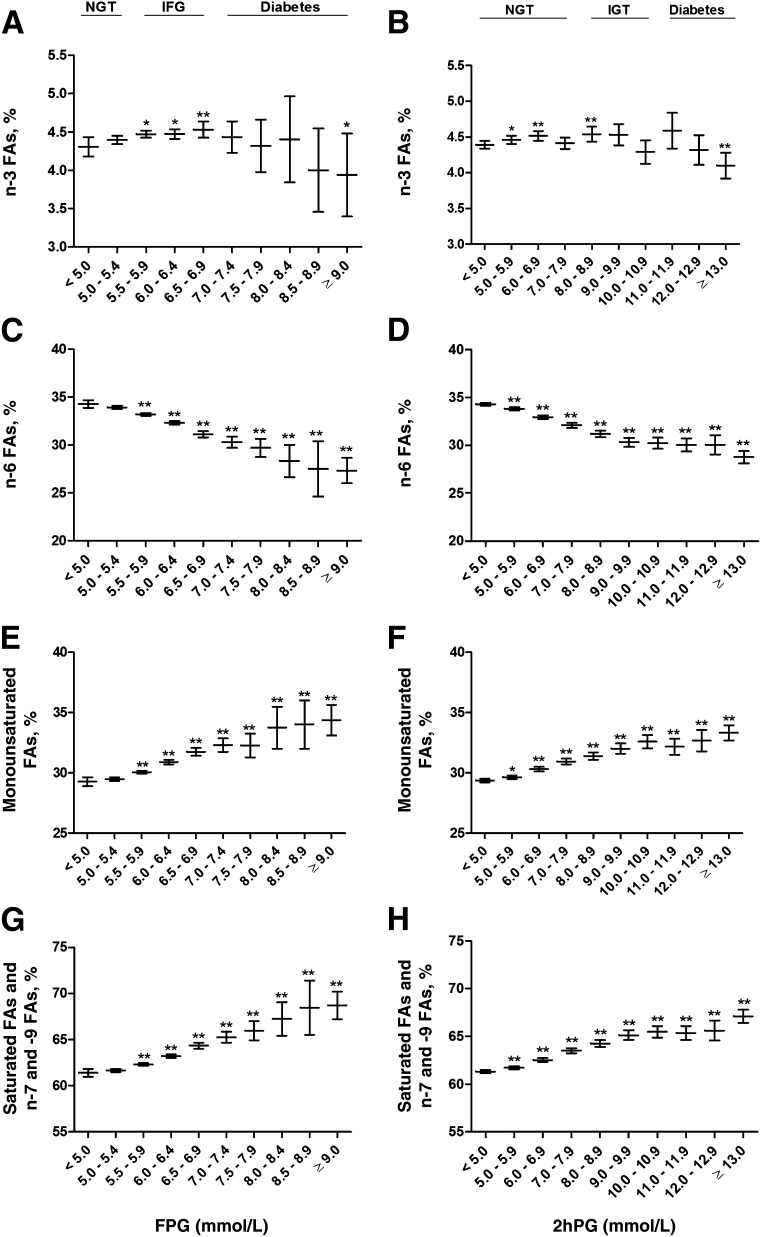
Figure 2.
Mean values and their 95% CIs of fasting levels of n-3 FAs (A and B), n-6 FAs (C and D), monounsaturated FAs (E and F), and saturated FAs and n-7 and -9 FAs (G and H) across the entire range of fasting and 2-h glucose categories in the cross-sectional METSIM Study cohort. P values (from ANOVA post hoc tests) indicating statistical significance with respect to the reference category (fasting or 2hPG <5.0 mmol/L) are coded as follows: *P < 0.05, **P < 0.01. P values for trends, adjusted for age and BMI, were as follows: 1.0 × 10⁻³ (A), 1.9 × 10⁻⁴ (B), 4.3 × 10−63 (C), 1.2 × 10−146 (D), 3.9 × 10−41 (E), 2.0 × 10−78 (F), 5.1 × 10−52 (G), and 6.1 × 10−132 (H).

