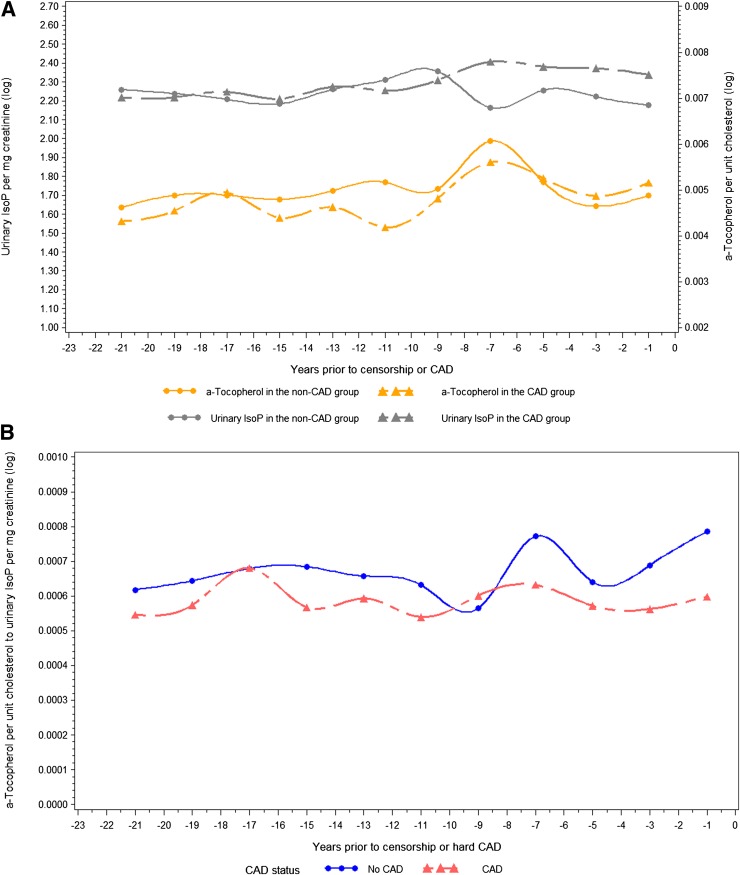
Figure 1.
α-Tocopherol and urinary IsoP trajectories (A) and α-tocopherol-to-urinary IsoP ratio trajectories (B) (adjusted for duration of diabetes, race, sex, BMI, having ever smoked, HbA1c, hypertension, HDL and non-HDL cholesterol, albumin excretion rate (log), estimated glomerular filtration rate, and white blood cell count) before a CAD event or the end of follow-up.

