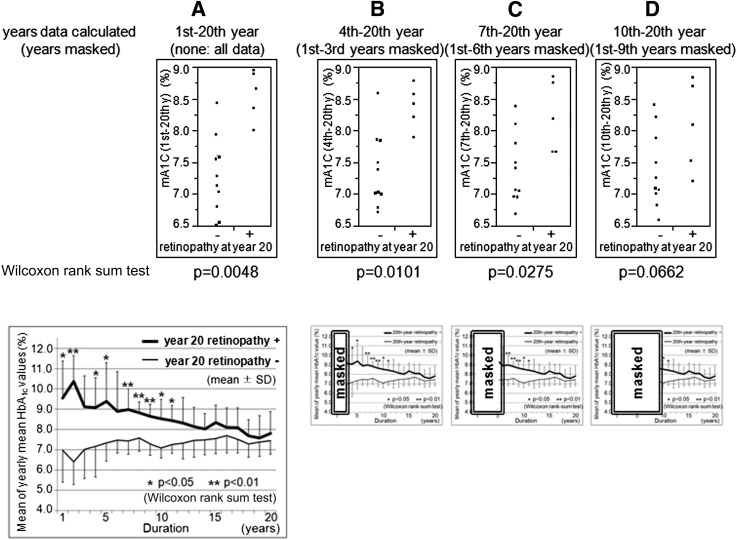
Figure 1.
Differences in the values of HbA1c variables between the retinopathy-positive and retinopathy-negative groups at year 20. A–D: Distributions of the mA1C values by the two groups. Calculated from the total of the real data (A, top) and from the partially masked data in simulation (B–D, top). A (bottom): Difference in the transitions of the yearly mean HbA1c values between the two groups over the course of 20 years. B–D (bottom): Small figures indicate the years masked in simulation. y, year.

