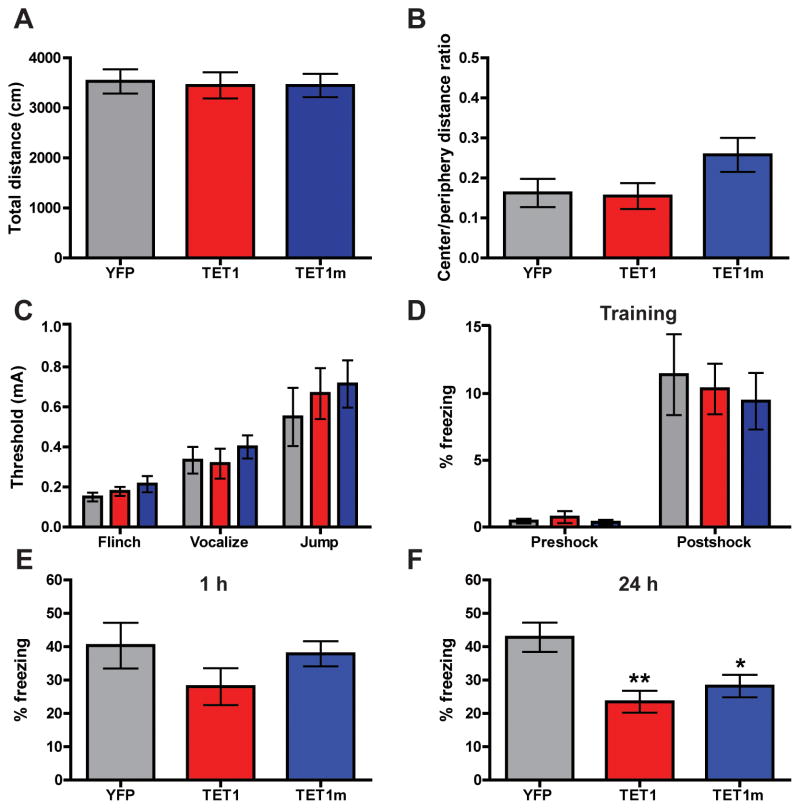
Figure 4. Behavioral characterization of mice overexpressing TET1 and TET1m in the dorsal hippocampus.
(A) Total distance traveled during 15 min in the open field. (B) The ratio of time spent in the center versus time spent in the periphery of the open field, a measure of anxiety. (C) Shock threshold test. (D) Percent of time freezing before and after presentation of the foot shock during the 3 min training session. (E) Percent of time freezing during a 5 min context test, 1 h after training. For experiments A–C, E n = 9 for all groups. (F) Percent of time freezing during a 5 min context test, 24 h after training (F2, 58 = 7.185). YFP vs. TET1 and TET1m. **p < 0.01, *p < 0.05; one-way ANOVA followed by Bonferroni post hoc test. For experiments D and F; AAV-YFP (n = 17), AAV-TET1 (n = 21), AAV-TET1m (n = 21). All data are presented as mean ± s.e.m.

