
Figure 2.
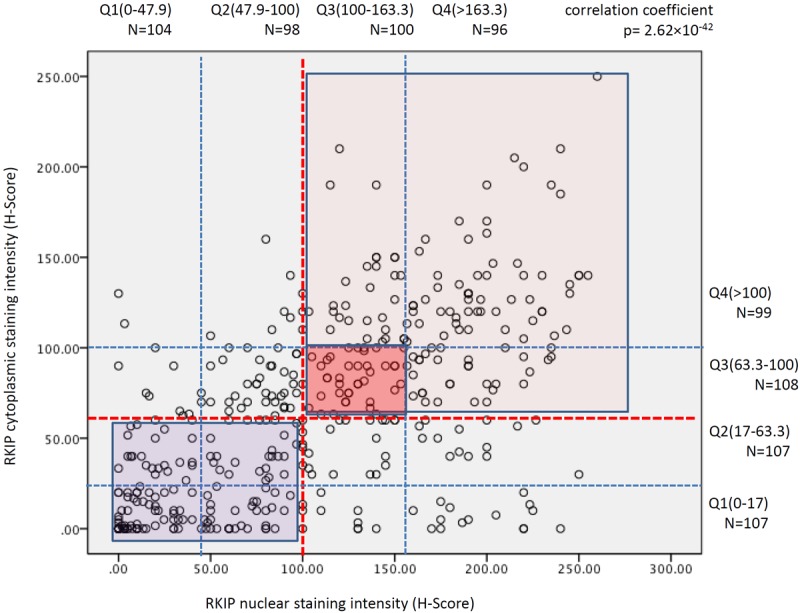
Correlation between nuclear and cytoplasmic RKIP expression in breast cancer. Red dashed lines indicate the median H-Score staining values for RKIP expression and the thin blue dashed lines demarcate the quartiles shown above for cytoplasmic and to the right for nuclear expression. Dark blue rectangle indicate samples with diminished or loss of RKIP expression in the cytoplasm and nuclei, dark pink square demarcates samples with intermediate expression and pink square shows those samples that expressed RKIP strongly in their nuclei and cytoplasm.