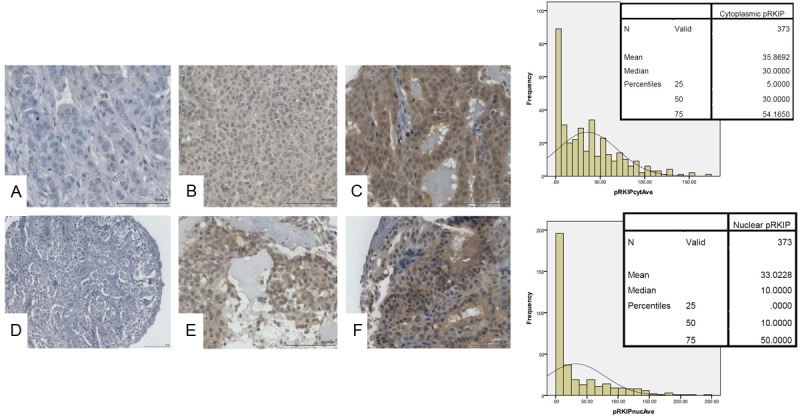
Figure 5.

Representative immunohistochemical staining for p-RKIP in breast cancer tissue microarray. Top panel shows cytoplasmic p-RKIP expression while lower panel shows nuclear p-RKIP expression. The bar charts depict the frequencies against the H-Scores obtained in 373 cases of breast cancer samples with the means, medians and percentiles shown in the inset. A and D show negative, B and E intermediate and C and F strong p-RKIP expression in cytoplasm and nuclei respectively.
