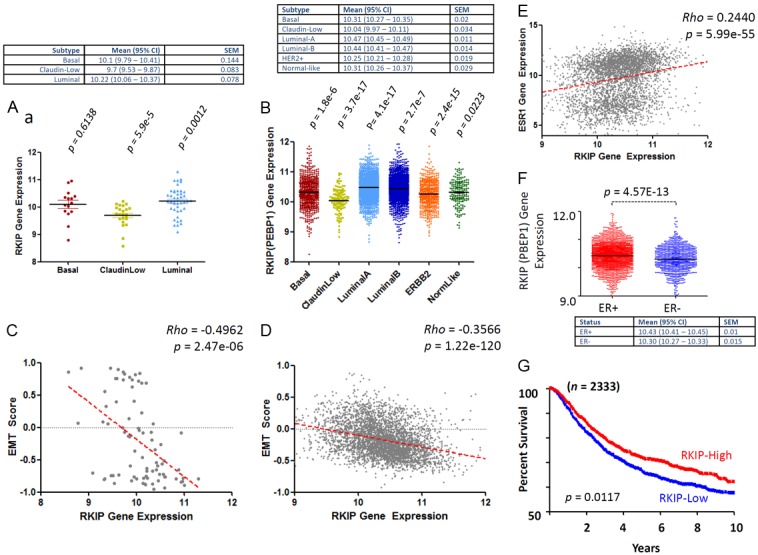
Figure 9.

Association between RKIP expression, EMT, molecular subclasses, ER and DFS of breast cancer. Median RKIP expression levels obtained from 81 samples (Table 2) from 70 different breast cancer cell lines. (A) and 3992 clinical breast cancer cases (B) after appropriate molecular subclassification. (C and D) Show the inverse correlation between RKIP expression and EMT scores obtained in cell lines and clinical breast cancer samples respectively. (E) Direct and linear correlation between RKIP and ER expression in breast cancer samples. (F) Shows the median values and distribution of RKIP mRNA levels in ER+ and ER- breast cancer samples. (G) Shows Kaplan-Meier’s disease-free survival curves between high (>median) and low RKIP (≤median) expressing breast cancer samples. The p values compare each subclass with the rest of subclasses. Rho statistic was used to establish the linear correlation between RKIP expression and EMT. The Log-Rank test was used to compare the statistical difference in DFS for this cohort.
