
Figure 1.
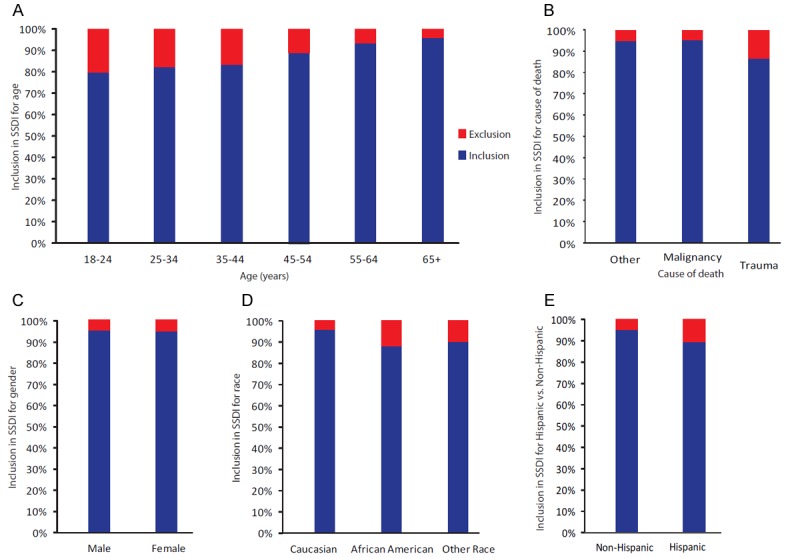
The overall inclusion in the SSDI by category. The overall percentage included in the SSDI is shown here. A: Inclusion by age in 6 categories. B: Inclusion by cause of death (malignancy, trauma, other). C: Inclusion by gender. D: Inclusion by race (Caucasian, African American, other race). E: Inclusion for Hispanic versus non-Hispanic persons.