
Figure 1. Change in lean soft tissue (kg) by ADRA2BGlu9/12 genotype following 12 months of resistance training versus control, no exercise.
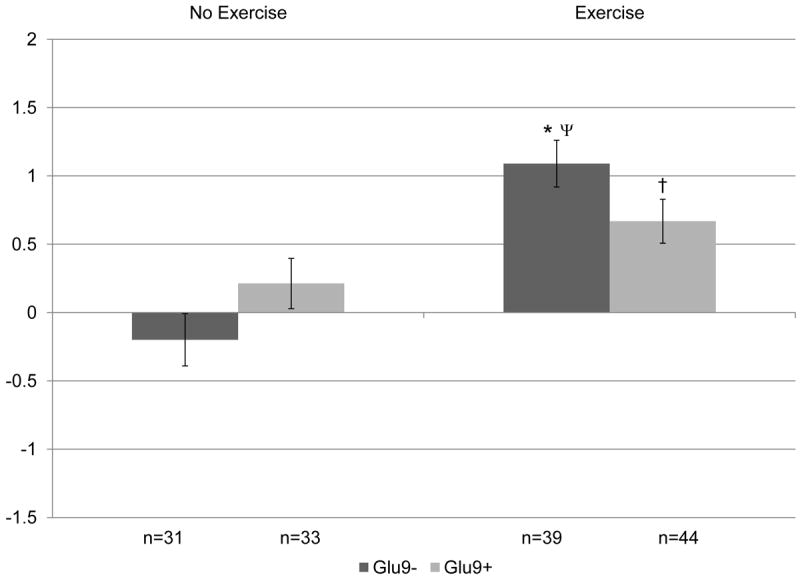
Covariates include: age, hormone therapy status, and baseline lean soft tissue. P=0.02 for overall gene × exercise interaction. When split by genotype in exploratory analyses: *p<0.05 within genotype between no exercise and exercise groups; †p<0.1 within genotype between no exercise and exercise groups. When split by exercise in exploratory analyses: Ψp≤0.1 between genotype difference within intervention group.