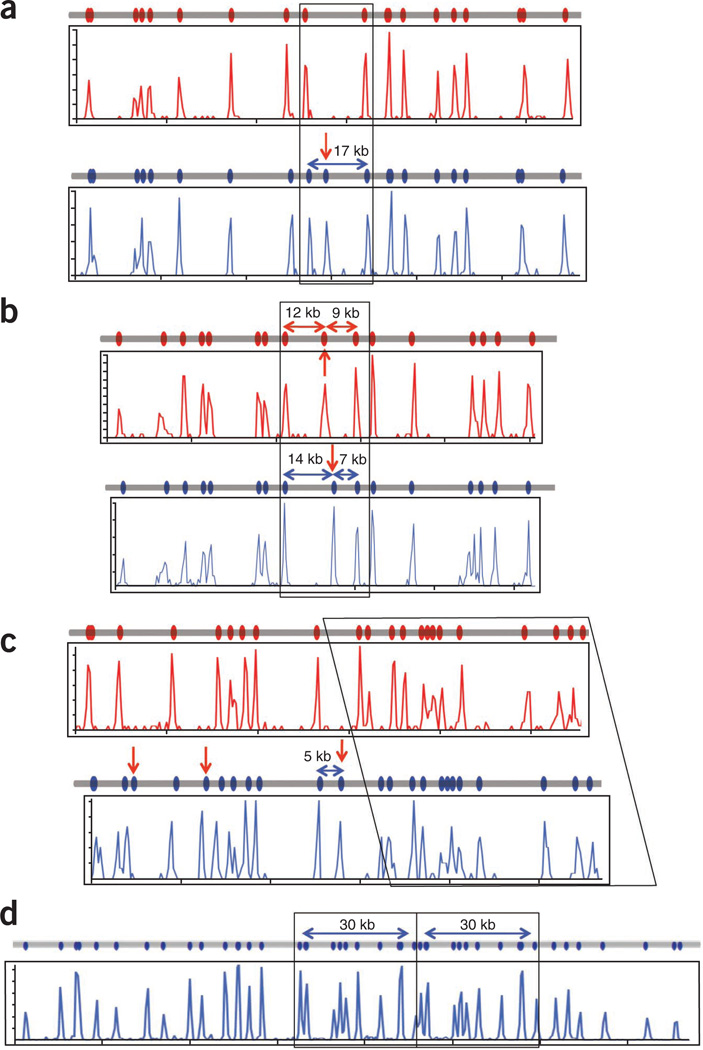
Figure 6.
Haplotype resolution and structural variation detected by genome mapping. (a) Single-site variation resulting from the creation or destruction of an Nt.BspQI site can be identified by genome mapping. The region in Figure 4a, ii shows that the PGF genome (blue line) contains an extra Nt.BspQI site not found in the COX genome (red line) with the maps generated by genome mapping (blue and red histogram plots) showing the expected pattern. (b) Shifting of a site relative to others in two haplotypes may be due to a double mutation or an inversion event. In Figure 4a, vi, the 21-kb region is split into 12- and 9-kb fragments in the COX genome (red line and red histogram plots) but 14- and 7-kb fragments in the PGF genome (blue line and blue histogram plot). (c) Insertions can be identified and localized by genome mapping for haplotyping resolution. In Figure 4a, v, the PGF genome has a 5-kb insertion that also includes an Nt.BspQI site (blue line, blue histogram plot) when compared to the COX genome (red line, red histogram plot). (d) A 30-kb duplication at the RCCX locus (Fig. 4a, iv) is identified and localized in both the reference map (gray line) and that produced by genome mapping (blue histogram plot).

