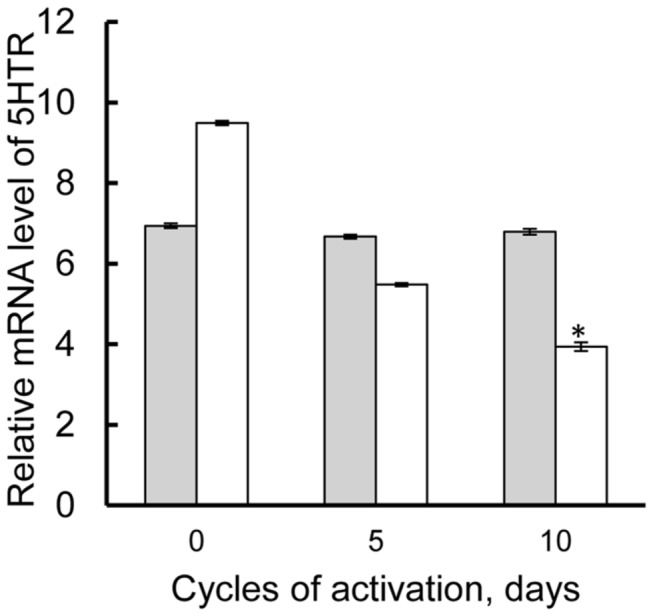
Figure 1. Relative mRNA levels of 5HTRs upon long-day activation.

Diapause pupae were exposed to LD 16:8 for 0, 5 and 10 cycles at 25°C and mRNA level of 5HTRA (gray bar) and 5HTRB (white bar) in the BR-SOG was determined by real time PCR. The results are presented as the mean ± S.E.M. from three independent experiments. Asterisks indicate significant difference from 0-day incubation by one-way ANOVA (Fisher's, LSD). p<0.05.
