
Figure 1. One sample t-test results.
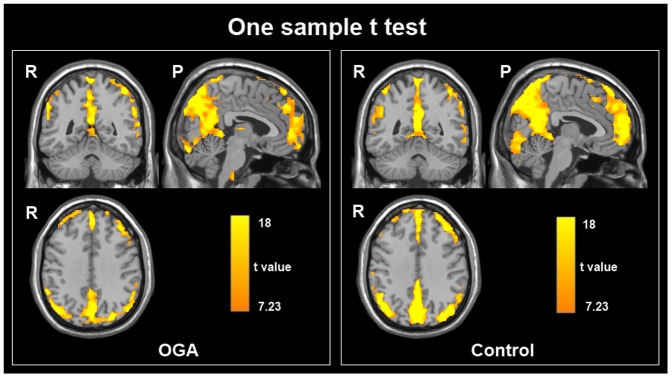
Within-group ALFF maps within the OGA and healthy control groups (p<0.05, FWE corrected, R, right; P, posterior).
Official websites use .gov
A
.gov website belongs to an official
government organization in the United States.
Secure .gov websites use HTTPS
A lock (
) or https:// means you've safely
connected to the .gov website. Share sensitive
information only on official, secure websites.
Within-group ALFF maps within the OGA and healthy control groups (p<0.05, FWE corrected, R, right; P, posterior).