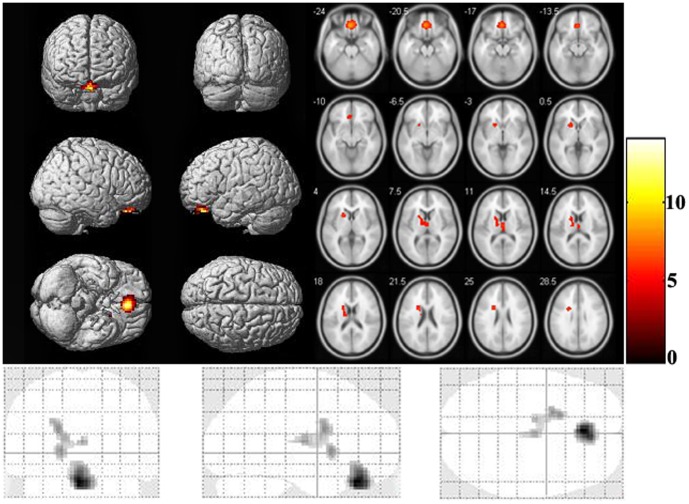
Figure 1. Brain areas with abnormal regional homogeneity in CCS-dependent individuals when compared with control groups.
The differences show in whole-brain MR rendering (top left), MR axial view (top right), and coronal (bottom left), sagittal (bottom middle), and axial (bottom right) glass brain map at the given threshold (cluster size >2106 mm3, T>2.7479 (or T<−2.7479) and P<0.01, correlated for p<0.05).

