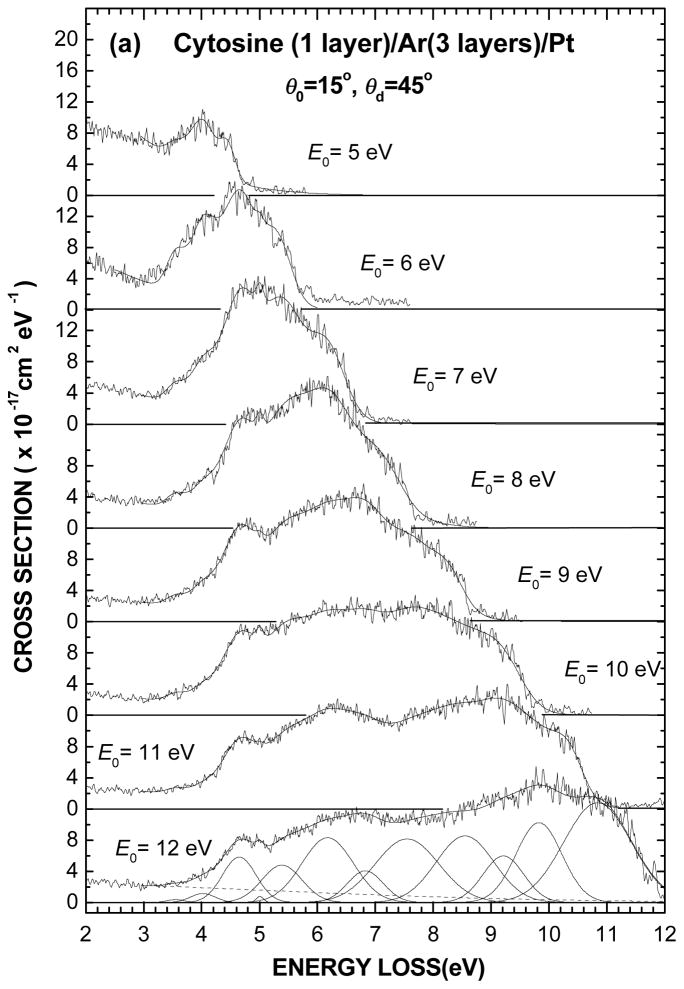
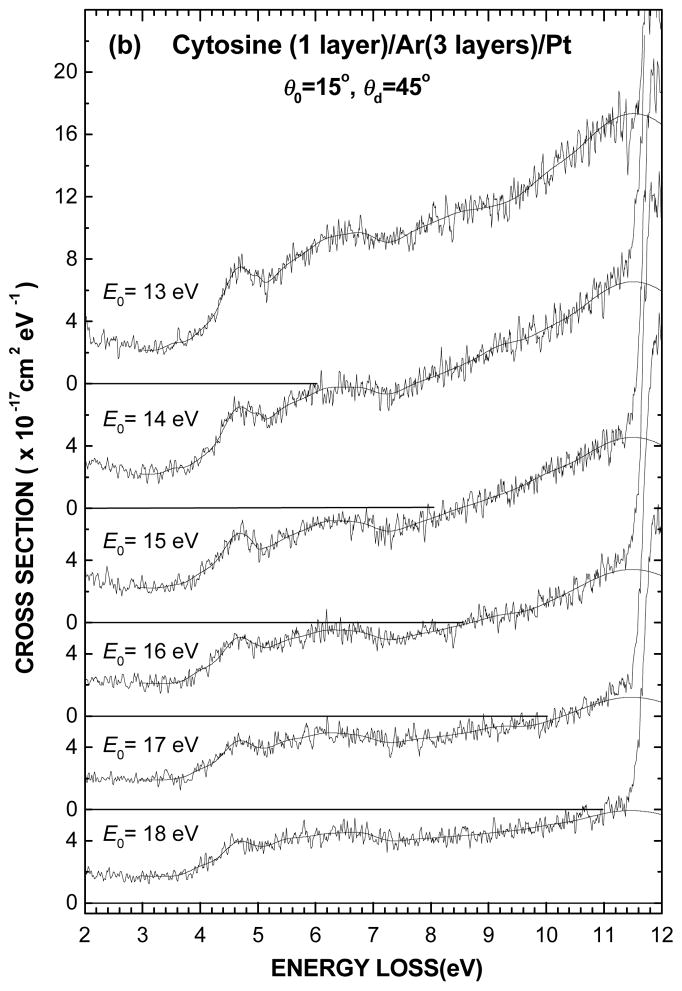
Fig. 2.
(a) Electronic EEL spectra of one layer of cytosine deposited on a 3-layer spacer of Ar for different incident electron energies E0 from 5 to 12 eV and (b) from 13 to 18 eV. The vertical scale is normalized so as the integral over an energy-loss range can be expressed in terms of a cross section value. The thin solid line passing through each spectrum results from curve fitting with of the multiple Gaussians obtained in Fig. 1 by varying only their amplitudes (i.e., keeping their energy positions and widths fixed), as shown in the bottom of Fig. 2(a).


