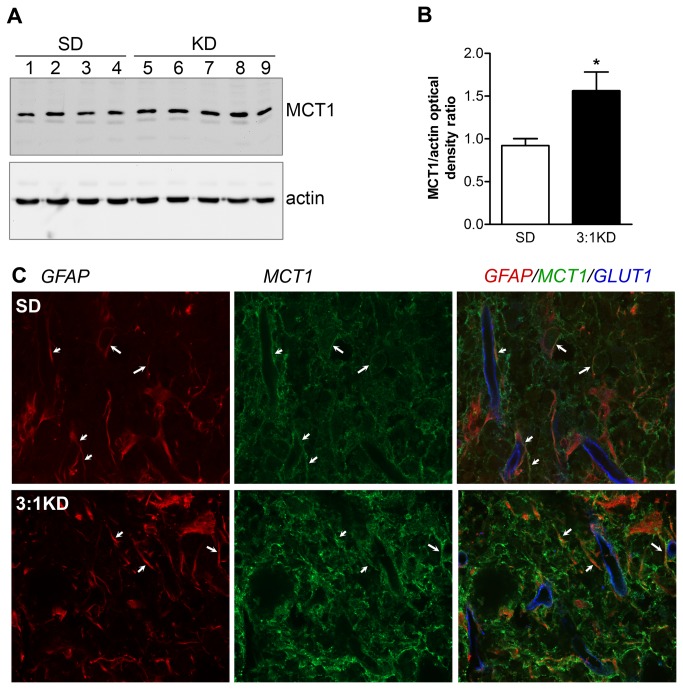
Figure 9. Monocarboxylate transporter-1 (MCT1) expression increased in spinal of KD fed rats at 14 days after SCI.
(A) Immunoblot of spinal cord samples probed with antibody to MCT1 showing the expected 42 kDa MCT1 band. As a control for equal protein loading, the corresponding actin signal is shown. (B) The relative MCT1 expression level was significantly higher (1.7-fold) in the KD group compared to the SD group (average of 4 rats). Values are normalized to actin values. Error bars indicate SEM. * p=0.021 (t-test). (C) Triple immunofluorescence confocal image to characterize the localization of MCT1 (green) on glial fibrillary acidic protein (GFAP, red) and glucose transporter-1 (GLUT1; blue) in the spinal cord of a KD fed rat (Spinning disc confocal microscope, 63x, 1.4 NA).

