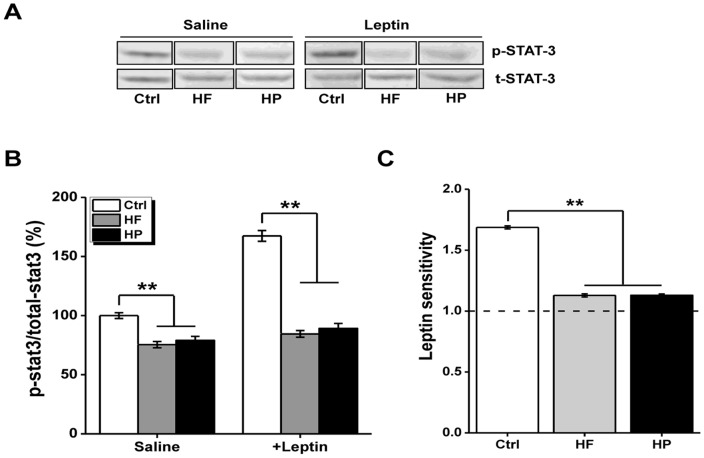
Figure 6. Phosphorylation of STAT-3 in the hypothalamus.
(A) Representative images for western blot experiement on total (t-) and phosphorylated (p-) STAT-3. n = 9 for Ctrl group, n = 10 for HF group, and n = 11 for HP group, respectively. (B) Measurement of the p-STAT-3/total-STAT-3 ratio in saline injected rats and in leptin injected rats. For clearly comparison, all the p-STAT-3/t-STAT-3 ratios were normalized to the mean value that obtained from the Ctrl group. (C) The sensitivity toward leptin assessed by a significant elevation of the mean p-STAT-3/t-STAT-3 in leptin-injected compared to saline-injected rats. **p<0.001, compared as indicated.

