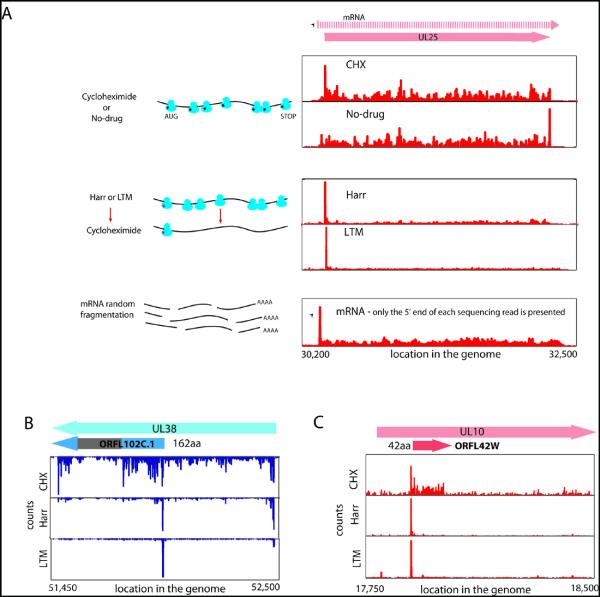
Fig. 1.
Ribosome profiling of HCMV infected cells.
(A) Ribosome occupancies following various treatments (illustrated on the left); cycloheximide (CHX), No-drug, harringtonine (Harr) and LTM together with mRNA profiles of the UL25 gene at 72 hpi. An arrow marks the mRNA start.
(B,C) Ribosome occupancy profiles for UL38 (B) and UL10(C) genes that contain internal initiations. The grey area symbolizes a low complexity region.

