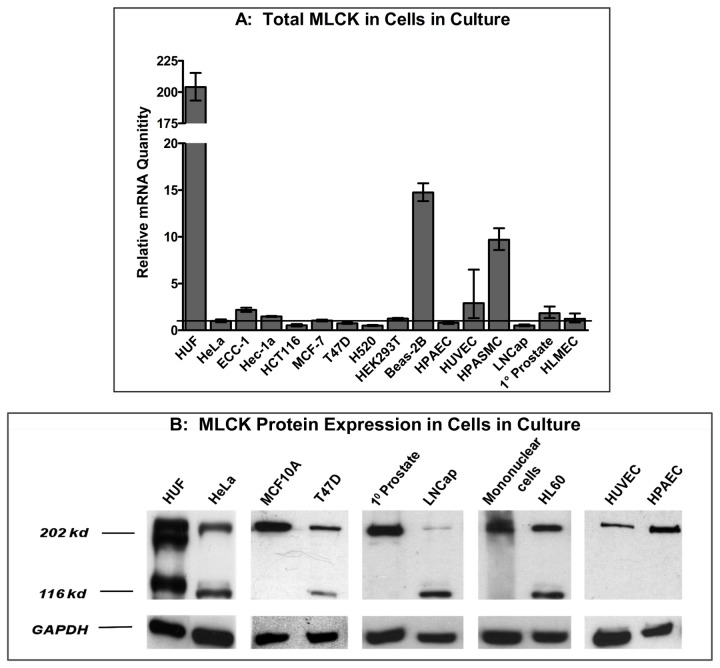
Figure 2. Analysis of MLCK expression in normal and cancer cells in culture.
Quantitative PCR to detect total MLCK (A) and western blot (B) analyses of normal and cancer cells in culture. RNA and protein were isolated from various cells and analyzed as described in Figure 1. The data in panel A depict the averages of qPCR analyses performed in triplicate.

