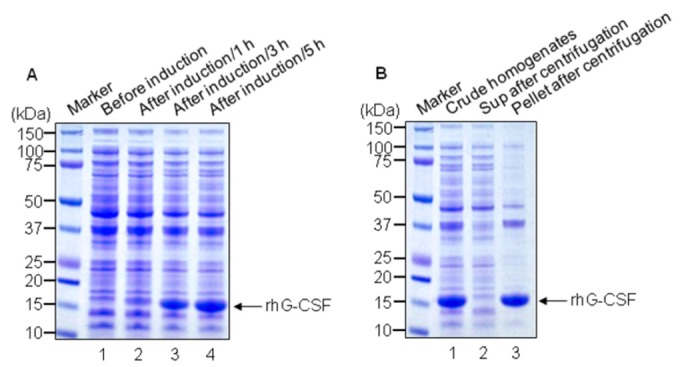
Figure 1. Analysis of rhG-CSF protein by SDS-PAGE.

Upon IPTG induction, rhG-CSF was analyzed using a 4–12% reducing SDS-PAGE gel followed by Coomassie brilliant blue staining. A. Lane 1, cell homogenates of E. coli JM109/pPT-G-CSF without IPTG induction; lane 2, cell homogenates after IPTG induction for 1 h; lane 3, After IPTG induction for 3 h; lane 4, After IPTG induction for 5 h. B. Lane 1, total homogenates; lane 2, supernatant after centrifugation; lane 3, Pellet after centrifugation. Most of IPTG induced rhG-CSF is pelleted after centrifugation. The arrow indicates rhG-CSF.
