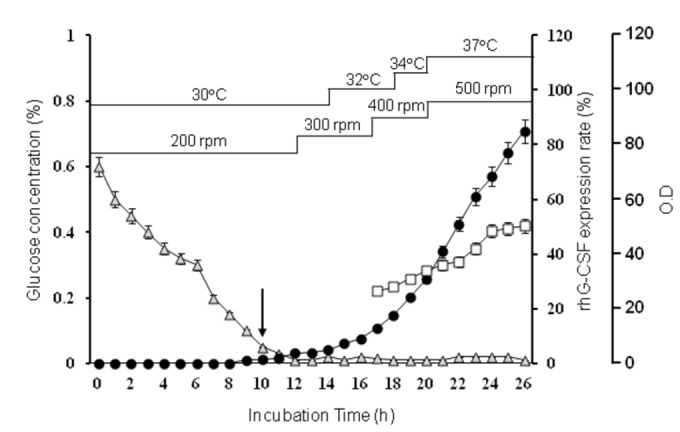
Figure 2. Cell growth and rhG-CSF expression during the fed-batch culture.

E. coli JM109/pPT-G-CSF cells were grown in fed-batch culture using temperature shift method in a 300-L fermentor with glucose as the energy source. Optical density was detected using a spectrophotometer at 600 nm. Glucose concentration (grey triangle); OD600 (●); Expression rate of rhG-CSF (□). The arrow indicates the start time of feeding.
