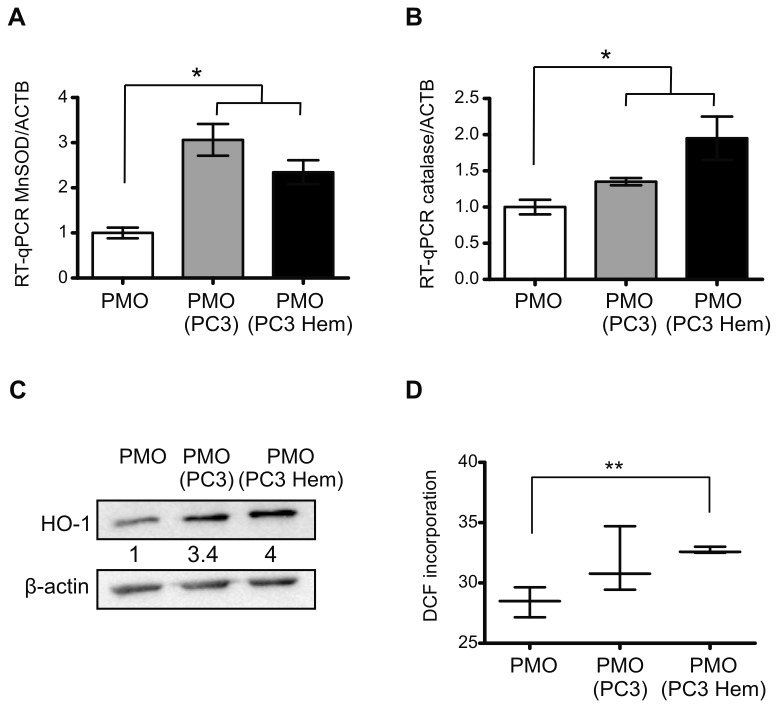
Figure 5. Co-culture with HO-1-induced PC3 cells induced oxidative stress markers in osteoblasts.
Experiments were done in PMOs grown alone (PMO), co-cultured with PC3 (PMO PC3) or with PC3 pre-treated with hemin (PMO PC3 Hem). Total RNA was extracted and MnSOD (A) and catalase (B) mRNA levels were analyzed by RT-qPCR. Data were normalized to β-actin and were expressed as fold induction respect to PMOs. HO-1 protein levels (C) were determined by Western blot analysis. The numbers under the bands indicates the quantitation normalized to β-actin and PMOs alone. ROS levels (D) were determined in PMOs incubated with CM2-DCFHDA and measured by flow citometry in the FITC channel (Significant difference, * P<0.05; ** P<0.01).

