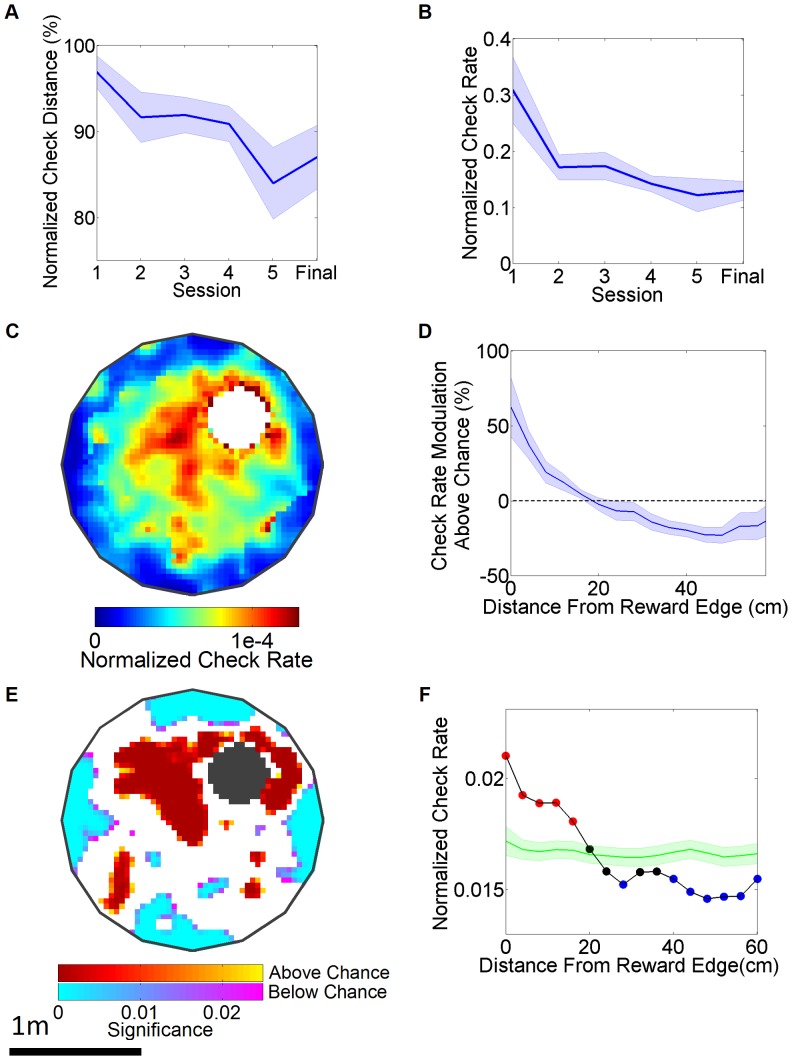
Figure 2. Analysis of reward checking behavior during the virtual audiovisual spatial navigation task.
(A) Acquisition curve of normalized check distance across sessions and during final task performance. This is calculated as: Mean actual distance/Mean randomized distance x 100. Note that the 6th day of acquisition was lost to malfunction of capacitive sensor. “Final” indicates performance average across the final four task sessions. Effect of session: F(5,35) = 3.384, p = 0.018, p<0.05 for 1st vs. 5th session, N = 6. (B) Normalized check rate across sessions. Effect of session: F(5,35) = 4.452, p = 0.0049, p<0.05 for 1st vs. 4th session (C) 2-D histogram of the normalized check rate averaged across rats during final task performance. (D) Check rate modulation as a function of radial distance away from the reward zone in 4 cm radial bins for final task performance. Effect of bin, F(14,89 = 9.241, p<0.0001, p<0.05 for closest bin relative to 3rd through 15th bins. (E) 2-D p-value map of a single rat’s performance during the final task performance. Red indicates regions where checking behavior was significantly modulated above chance (p<0.01) and blue indicates regions where checking behavior was significantly below chance. (F) Example of actual checking behavior (black line) as a function of radial distance from the reward zone relative to random checking behavior (green line, with shaded SE). Red dots represent points significantly above chance and blue dots represent points significantly below chance.

