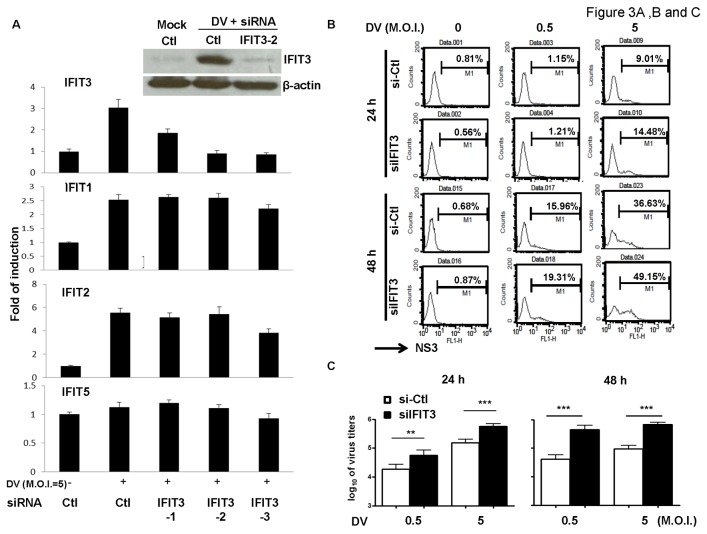
Figure 3. IFIT3 knockdown with siRNA without affecting other ifit genes increased DV production.
A549 cells were transfected with different siRNAs (si-Ctl, siIFIT3-1, siIFIT3-2 or siIFIT3-3) for 24 h and then infected with mock or DV for 13 h. Expression of mRNA of ifit genes and IFIT3 protein was determined by quantitative RT/PCR and western blotting, respectively (A). Data show results of 3 independent experiments. A549 cells transfected with control siRNA (si-Ctl) or IFIT3 siRNA (siIFIT3-2) for 24 h were infected by mock or DV at M.O.I. = 0.5 or 5 for an additional 24 or 48 h. Cells were collected for measurement of expression of intracellular NS3 by flow cytometry (B). Supernatants were collected to determine virus titers by plaque assays (C). Data show results pooled from at least 3 independent experiments. The analysis was performed by ANOVA as described in Materials and Methods. **P < 0.01, ***P < 0.001. Ctl stands for control.

