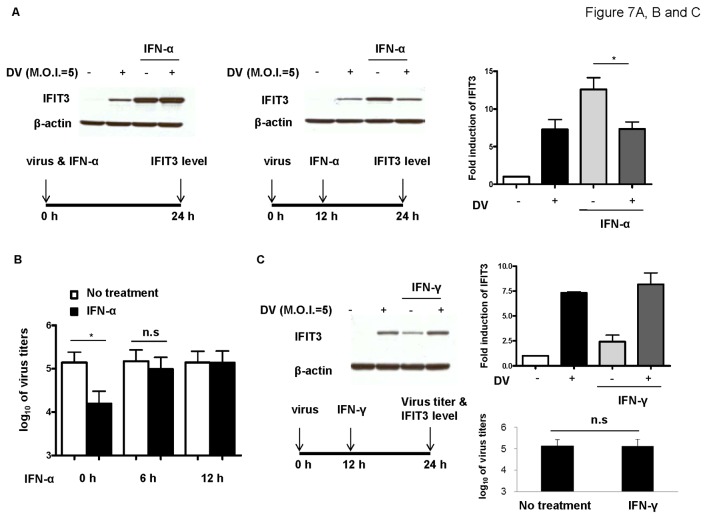
Figure 7. Effects of simultaneous or post-infection treatment with IFN-α or IFN-γ on IFIT3 expression and DV production.
Shortly after viral absorption, DV-infected A549 cells (1 x 10⁵/mL) were treated with 1000 units IFN-α and incubated for an additional 24 h. Alternatively, 1000 units IFN-α were added into the culture medium 12 h after virus infection and incubated for an additional 12 h. Expression of IFIT3 was determined by western blotting, and relative band intensities were quantified, right panel (A). IFN-α was added simultaneously with DV infection or 6 h or 12 h after DV infection. After incubation for additional 12 h, the supernatants were collected and virus titers were measured by plaque assays (B). Similar to (A), A549 cells infected by mock or DV for 12 h were treated with 100 units IFN-γ, and the cell cultures were then maintained for an additional 12 h. IFIT3 levels in cell lysates and virus titers in supernatants were determined (C). Data represent results from 3 independent experiments. The analysis was performed by ANOVA (A and B) or student’s T test (C) as described in Materials and Methods. *P < 0.05. n.s: no significance.

