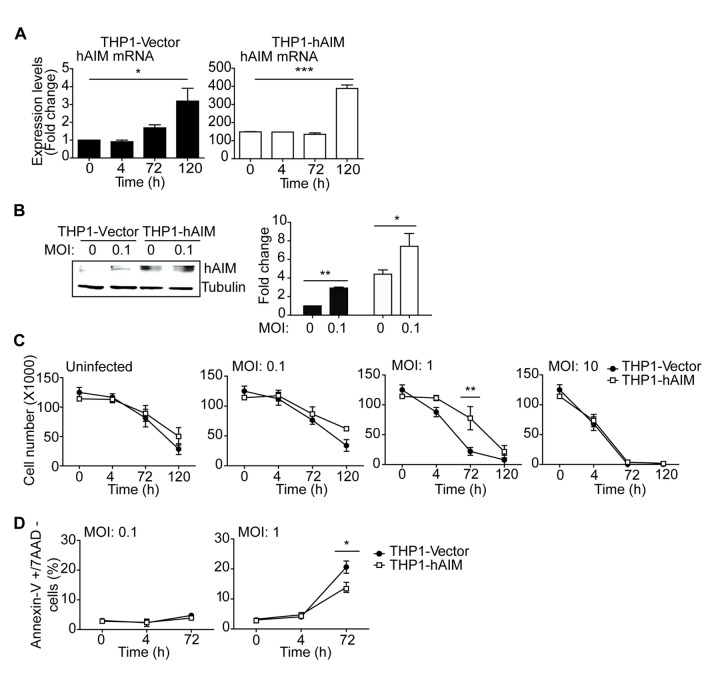
Figure 2. Expression of hAIM infection increases the survival of M. tuberculosis-infected MФ.
Stably transfected THP1-Vector (control) and THP1-hAIM MФ were infected with M. tuberculosis at the indicated MOIs, and hAIM expression and cell viability were analyzed at the indicated time points. A) Mean ± SEM mRNA of hAIM expression were determined by RT-qPCR on cells infected at MOI 0.1. hAIM mRNA values are represented as fold change vs. uninfected THP1-Vector cells, set as 1. *p≤0.05; ***p≤0.001; one-way ANOVA. B) Western blot analysis of hAIM protein levels in cell lysates at MOI 0.1 and 0 to 120 h post-infection. Equal loading was determined by probing against tubulin. Left panel, western blot; right panel, fold induction levels, which were calculated by setting the background signal of uninfected THP1-Vector cells to 1 as a reference. C) The number of viable cells was determined by crystal violet staining and quantified using a standard curve of known input cell numbers. D) Apoptosis was assessed using Annexin V-7AAD staining and analyzed by flow cytometry. Results are expressed as percentage of Annexin V-positive, 7AAD-negative cells. All graphs are from three independent experiments performed in triplicate. *p≤0.05; **p≤0.01; two-way ANOVA.

