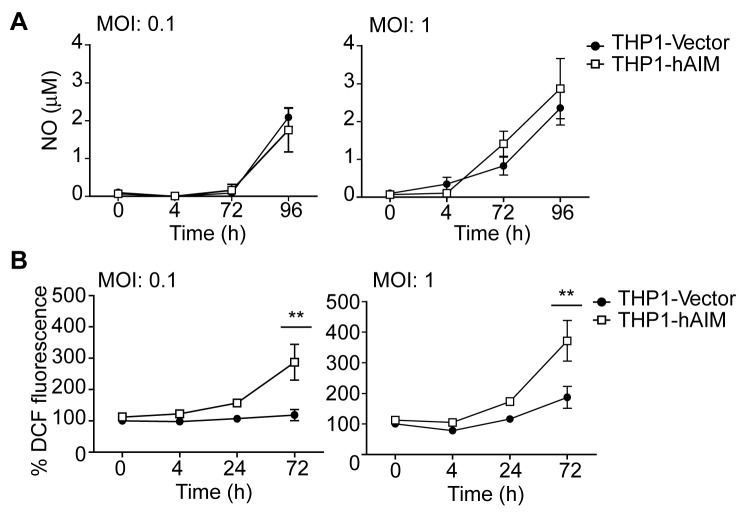
Figure 5. Effects of hAIM on NO and ROS production.
THP1 MФ were infected with M. tuberculosis at MOI 0.1 and 1 during the times indicated, and the production of NO and ROS was determined as follows. A) Nitrite levels were measured in the supernatants using the Griess reagent, and values were calculated against a standard curve of known NaNO2 concentrations. B) Intracellular ROS release was quantified via the changes of DCF fluorescence. ROS levels were calculated as a percentage of the uninfected control (THP1-Vector cells), indicated as 100%. Mean ± SEM from three independent experiments, performed in triplicate are shown. *p≤0.05; **p≤0.01; two-way ANOVA.

