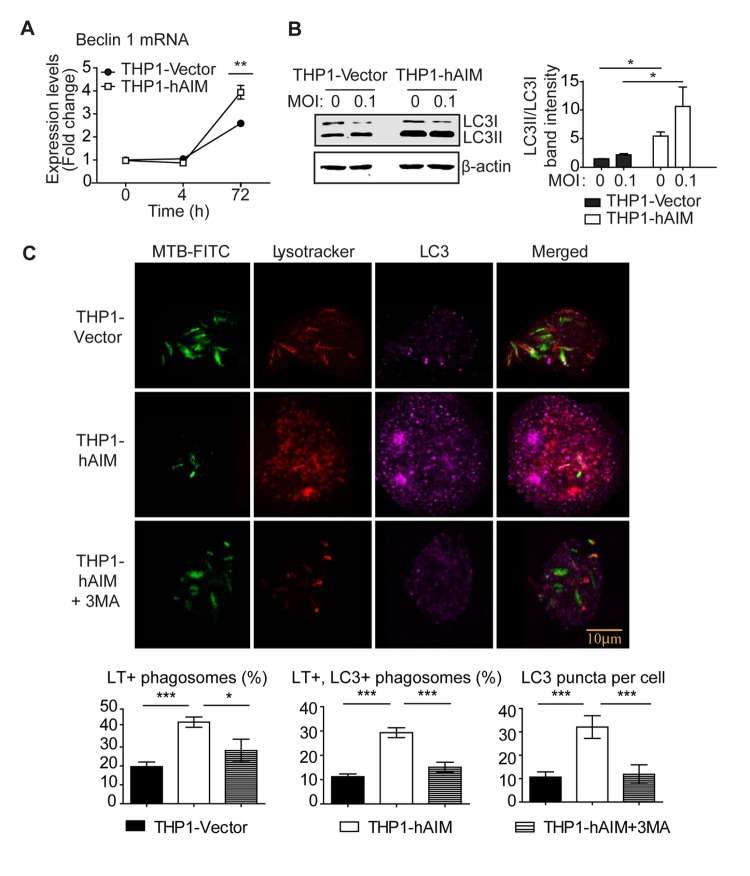
Figure 7. hAIM promotes autophagy and endosome-lysosome fusion in M. tuberculosis-infected THP1 cells.
Stably transfected THP1 MФ were infected with M. tuberculosis H37Rv at MOI 0.1, and autophagy was analyzed as follows. A) mRNA levels of autophagy related protein Beclin 1 were determined by RT-qPCR at the indicated times. mRNA mean fold change values are relative to uninfected THP1-Vector ± SEM, set as 1, from three independent experiments. *p≤0.05; **p≤0.01; ***p≤0.001 two-way ANOVA. B) LC3 expression was analyzed by Western blot in cell lysates of uninfected and M. tuberculosis-infected THP MФ for 24 h. Left: representative Western blot image. Right: protein signal intensities were quantified and plotted as LC3-II/LC3-I ratio after normalization to the control protein actin. Mean ± SEM of three independent experiments. *p≤0.05; **p≤0.01; ***p≤0.001, one-way ANOVA. C) M. tuberculosis-lysosome co-localization analysis. Upper panel: representative confocal microscopy images showing co-localization of FITC-labeled M. tuberculosis bacilli (green), cellular lysosomes (red) and LC3 (purple) 72 h post-infection, in the presence or absence of the autophagy inhibitor 3-MA. Lysosomes were stained with LysoTracker Red, and LC3 with a specific antibody. Lower panel: mean ± SEM quantitative data show M. tuberculosis-lysosome, M. tuberculosis-lysosome-LC3 co-localization and LC3 puncta per cell in three independent experiments, with each experiment including at least 200 internalized bacilli or 100 cells scored in random fields. *p≤0.05; **p≤0.01; ***p≤0.001, one-way ANOVA.

