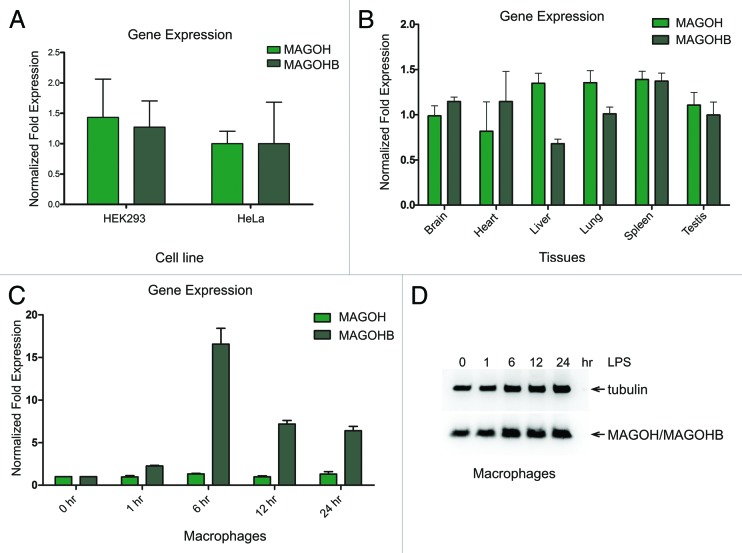
Figure 2. Expression of MAGOH and MAGOHB transcripts. (A) Quantitative RT-PCR analysis of endogenous MAGOHB and MAGOH transcripts in HEK293 and HeLa cells. The expression levels were normalized to TATA binding protein (TBP). (B) Quantitative RT-PCR analysis of the MAGOHB and MAGOH transcripts levels in various tissues of three adult mice (data of individual mice are shown in Fig. S2). (C) Quantitative RT-PCR analysis of the MAGOHB and MAGOH transcripts levels in murine derived macrophages that were stimulated with LPS (10 ng/mL) for 0, 1, 6, 12, and 24 h. Data presented in (A–C) represent the mean value (± standard deviation) obtained from three independent experiments. (D) Western blot of macrophages that were stimulated with LPS (10 ng/mL) for 0, 1, 6, 12, and 24 h. MAGOH protein levels were assessed with MAGOH-specific antibodies.

An official website of the United States government
Here's how you know
Official websites use .gov
A
.gov website belongs to an official
government organization in the United States.
Secure .gov websites use HTTPS
A lock (
) or https:// means you've safely
connected to the .gov website. Share sensitive
information only on official, secure websites.
