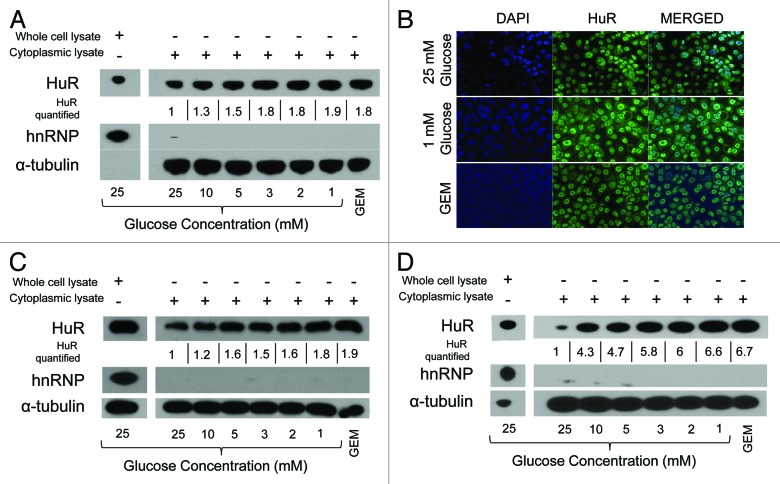
Figure 2. HuR protein is activated to the cytoplasm under glucose deprivation. (A) Immunoblots of whole cell (left) and cytoplasmic (right) lysates from MiaPaCa2 cells cultured for 6 h in media with the indicated glucose concentrations. Gemcitabine (GEM) (1 µM) was used as a positive control for cytoplasmic HuR activation. HuR (and GEM) levels are quantified at each glucose concentration and numeric values are displayed normalized to control glucose conditions below the corresponding cytoplasmic HuR band. Immunofluorescence at 12 h (B) and immunoblots at 6 h (C) of BxPC3 cells in normal DMEM (25 mM glucose), 1 mM glucose DMEM and 1 µM gemcitabine (positive control). Nuclei are counterstained in blue (DAPI). Immunoblots of (D) PANC1 cells after incubation in the indicated glucose concentrations for 6 h. Relative HuR levels are quantified, as described for panel (A).

An official website of the United States government
Here's how you know
Official websites use .gov
A
.gov website belongs to an official
government organization in the United States.
Secure .gov websites use HTTPS
A lock (
) or https:// means you've safely
connected to the .gov website. Share sensitive
information only on official, secure websites.
