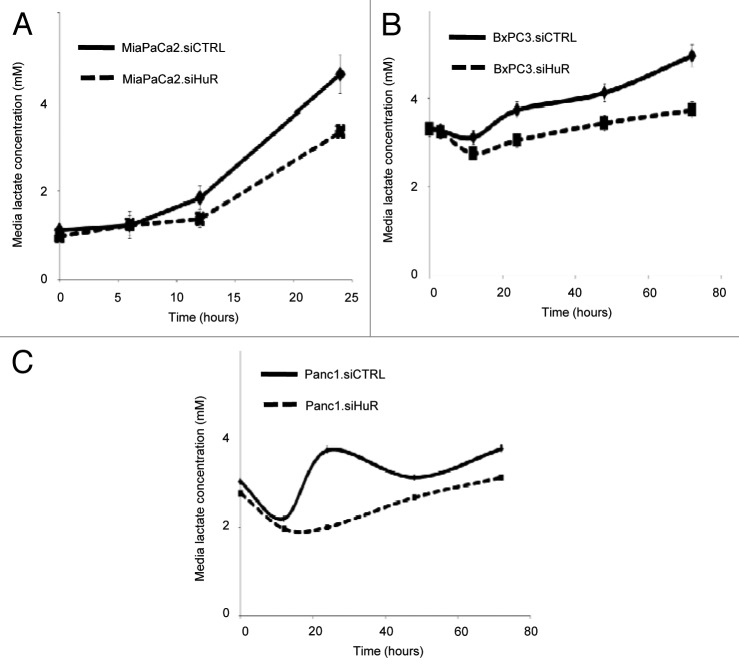
Figure 3. HuR expression affects lactate production of pancreatic cancer cells. Lactate levels in the media over time. siCTRL are solid lines; siHuR are dashed lines. The starting glucose concentration for these experiments was 5 mM. (A) MiaPaCa2 cells, (B) BXPC3 cells and (C) PANC1 cells. Lactate levels are normalized to total cell count in each well.

An official website of the United States government
Here's how you know
Official websites use .gov
A
.gov website belongs to an official
government organization in the United States.
Secure .gov websites use HTTPS
A lock (
) or https:// means you've safely
connected to the .gov website. Share sensitive
information only on official, secure websites.
