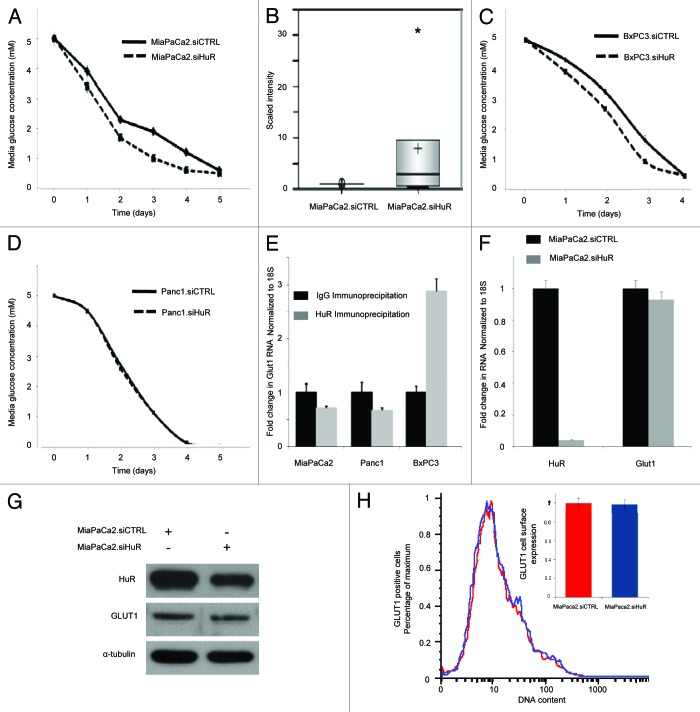
Figure 4. HuR expression affects glucose uptake into pancreatic cancer cells independent of GLUT1. In glucose concentration curves: siCTRL are solid lines; siHuR are dashed lines. (A) Glucose levels in the media (5 mM starting glucose) over time in MiaPaCa2 cell culture. (B) Box plot of intracellular glucose levels detected by GC/MS and LC/MS/MS platforms in MiaPaCa2 cells incubated in 25 mM glucose (*p < 0.1). Glucose levels in the media (5 mM starting glucose) over time in (C) BxPC3 cells and (D) PANC1 cells. (E) Ribonucleotide immunoprecipitation and qPCR for GLUT1 demonstrating that GLUT1 does not bind HuR (gray bars), relative to IgG (black bars) in MiaPaCa2 and PANC1 cell lines. BxPC3 cells demonstrated mild enrichment of GLUT1 mRNA in the HuR sample relative to the IgG sample. The HuR target, dCK, served as a positive control (data not shown, MiaPaCa2: 8 fold increased binding; PANC1: 4 fold increased binding; BxPC3: 3-fold increased binding). (F) qPCR of GLUT1 mRNA in MiaPaCa2.siHuR (gray bars) and MiaPaCa2.siCTRL cells (black bars). (G) Immunoblots for HuR, GLUT1 and α tubulin of whole cell MiaPaCa2 lysates 72 h following transfection with siRNA oligs. (H) Flow cytometric analysis of GLUT1 cell surface expression of MiaPaCa2.siHuR (blue) and MiaPaCa2.siCTRL cells (red, set to a value of 1 in the bar graph).

An official website of the United States government
Here's how you know
Official websites use .gov
A
.gov website belongs to an official
government organization in the United States.
Secure .gov websites use HTTPS
A lock (
) or https:// means you've safely
connected to the .gov website. Share sensitive
information only on official, secure websites.
