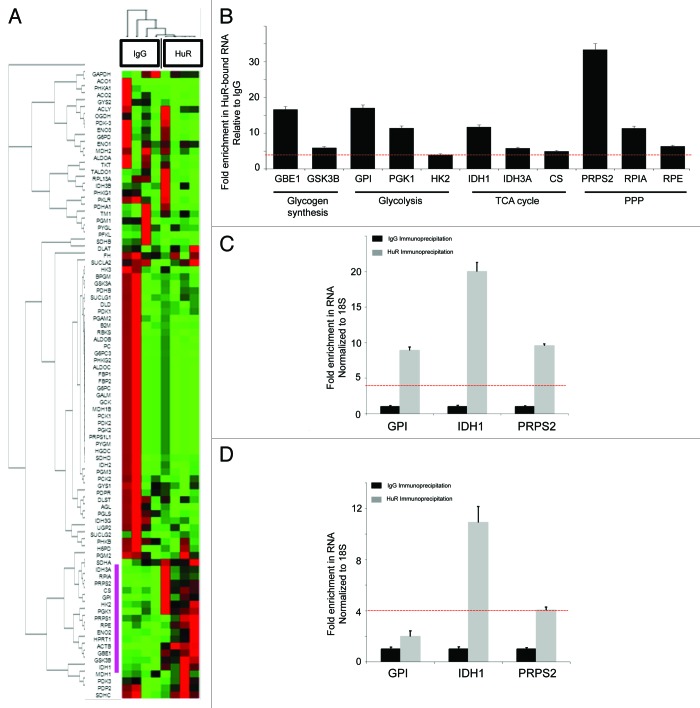
Figure 5. Identification of HuR metabolic target mRNAs through ribonucleotide immunoprecipitation assays. mRNA enriched by HuR immunoprecipitation were compared with an IgG control sample in MiaPaCa2 cells with an 84-gene glucose metabolism qPCR Array. (A) Heatmap/clustergram: red represents increased transcript levels with HuR RNP-IP compared with control, and green represents decreased levels. Genes enriched in the HuR sample at levels 4-fold or greater than the IgG sample are highlighted with a purple bar to the left of the heat map. (B) Eleven HuR targets are presented and grouped by pathway. RNA levels represent fold-change enrichment to HuR, relative to IgG. Data are normalized to GAPDH and the red dashed line (also present in panels C and D) indicate the predetermined cutoff used to define highly enriched HuR targets (greater than 4-fold enrichment in the HuR sample over IgG control). IDH1 was grouped with TCA cycle enzymes for the purposes of presentation, but technically is an isoenzyme of mitochondrial IDH and resides in the cytosol. GPI, IDH1 and PRPS2 were validated as HuR-bound mRNA targets by HuR RNP-IP and q-PCR in (C) BxPC3 and (D) PANC1 cell lines. HuR RNP-IP (gray bars) and IgG RNP-IP (black bars). PCR Arrays were normalized to GAPDH. qPCR assays were normalized to 18S.

An official website of the United States government
Here's how you know
Official websites use .gov
A
.gov website belongs to an official
government organization in the United States.
Secure .gov websites use HTTPS
A lock (
) or https:// means you've safely
connected to the .gov website. Share sensitive
information only on official, secure websites.
