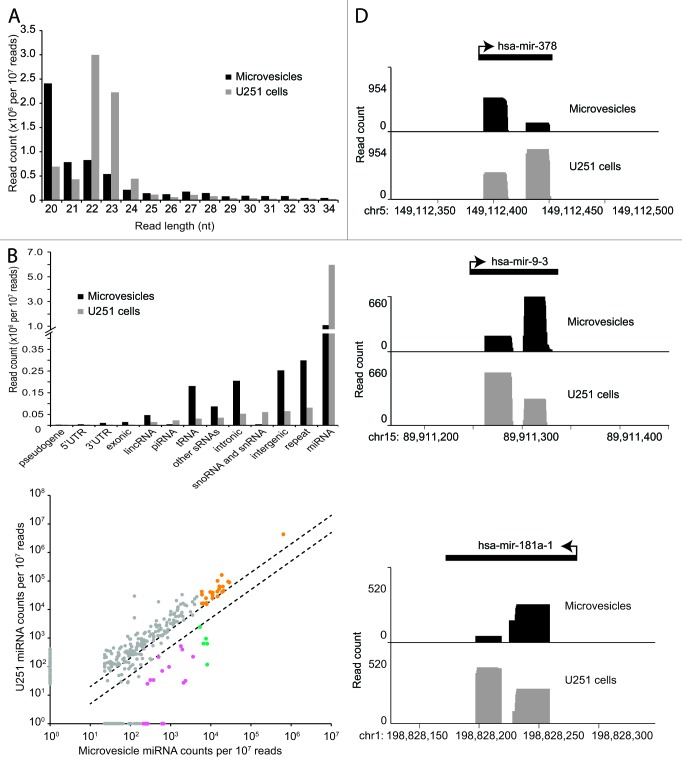
Figure 2. Specific miRNAs and miRNA variants are selectively packaged in glioma microvesicles. (A) Distribution of small RNA lengths in microvesicles and U251 cells. (B) Distribution of small RNA annotations in microvesicles and U251 cells. (C) Scatter plot of relative miRNA abundance in U251 parent cells and their microvesicles. Dashed lines indicate 2-fold enrichment/depletion; pink data points indicate enriched miRNAs with greater than 200 counts in the microvesicles as well as greater than 2-fold enrichment in the microvesicles compared with the U251 cells; orange points indicate abundant miRNAs with greater than 5,000 counts in the microvesicles; green indicates the overlap between these two groups. miRNAs that were present but did not meet the threshold of ≥ 10 reads are represented with an abundance of 1. (D) Plots of three representative miRNAs that exhibit 5p/3p arm-switching in microvesicles relative to the U251 parent cells.

An official website of the United States government
Here's how you know
Official websites use .gov
A
.gov website belongs to an official
government organization in the United States.
Secure .gov websites use HTTPS
A lock (
) or https:// means you've safely
connected to the .gov website. Share sensitive
information only on official, secure websites.
