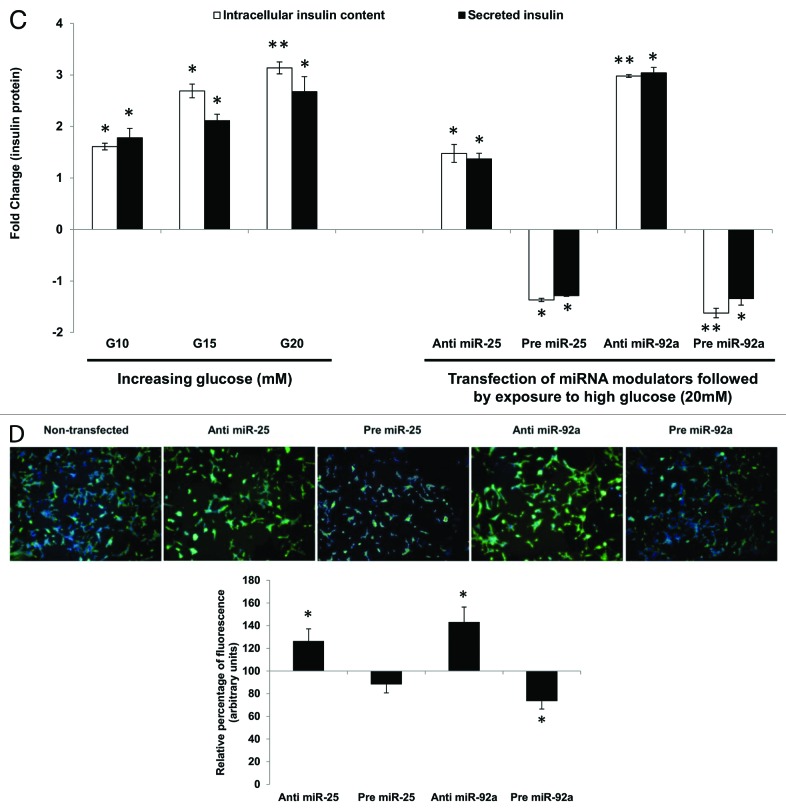
Figure 2C–D. (C) Changes in insulin protein in INS-1 cells. INS-1 cells were subjected to increasing glucose concentration (G10, 15, and 20 mM) to study relative changes in insulin protein (left panel). Data presented as mean ± SEM (n = 3) against control at 5 mM glucose concentration. Intracellular insulin content (in white bar) and secreted insulin (in black bar) are normalized to total protein content. Further, the effects of miR-25 and miR-92a on insulin protein were determined by modulating the expression of miRNAs independently (right panel). Following transfections, cells were subjected to high glucose (20 mM). Cells transfected with scrambled miRNAs (anti or pre) followed by the same high glucose (20 mM) treatment were used as corresponding controls. All transfections of miRNAs were done at 30 nM concentration. Data presented as mean ± SEM (n = 3) against control at 20 mM glucose concentration. Intracellular insulin content (in white bar) and secreted insulin (in black bar) are normalized to total protein content. Statistically significant differences are tested using t-test at p < 0.05 significance. *p < 0.05, **p < 0.01. (D) Insulin I immunoreactives in INS-1 cells transfected with either anti or pre miR-25 or miR-92a. The cells were fixed and immunolabeled with insulin I antibody (green) and nuclear stain Hoechst 33342 (blue). The data presented here is a representative of three independent experiments. Fluorescence signal quantitation was performed according to Su et al.60 using Varioskan® Flash (Thermo Scientific), whereby FITC fluorescence is measured at excitation 490 nm and emission 525 nm. Each signal is normalized to the number of cells by Hoechst 33342 fluorescence measured at excitation 346 nm and emission 460 nm. Relative fluorescence were obtained 48 h post-transfection by normalizing the values against cells transfected with corresponding anti- or pre-scrambled miRNAs. The fluorescence of the controls is considered to be 100%. All transfections of miRNAs were done at 30nM concentration. Data are presented as mean ± SEM (n = 3) against control. Statistically significant differences are tested using t-test at *p < 0.05 significance.

An official website of the United States government
Here's how you know
Official websites use .gov
A
.gov website belongs to an official
government organization in the United States.
Secure .gov websites use HTTPS
A lock (
) or https:// means you've safely
connected to the .gov website. Share sensitive
information only on official, secure websites.
