
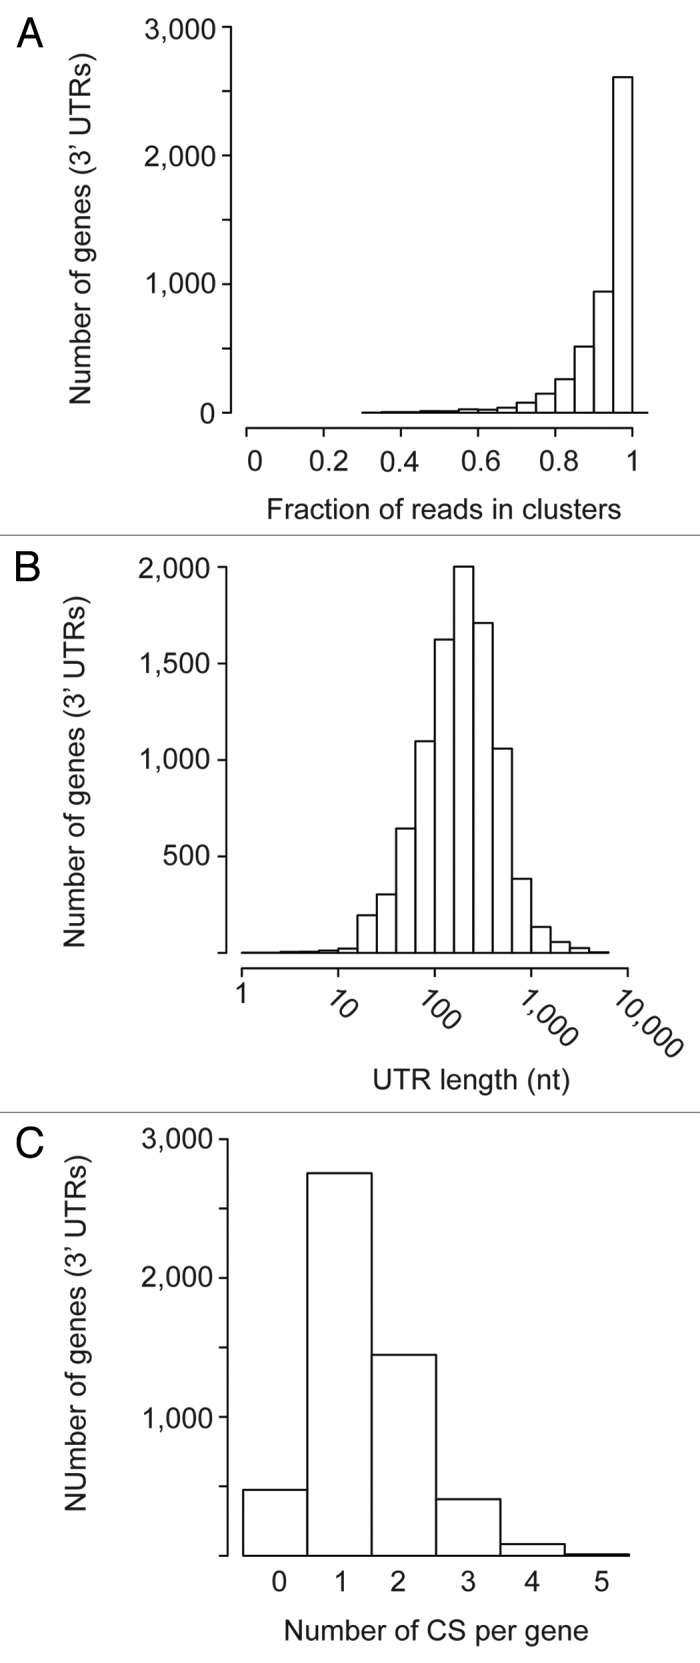
Figure 4. Analysis of poly(A) site usage in 3′ UTRs. The y-axes show the number of genes in each category. (A) Histogram showing the fraction of reads that could be assigned to a cluster within a 3′ UTR. (B) Histogram of 3′ UTR lengths, calculated using the peak of each cluster. (C) Histogram displaying the number of identified CSs per 3′ UTR.