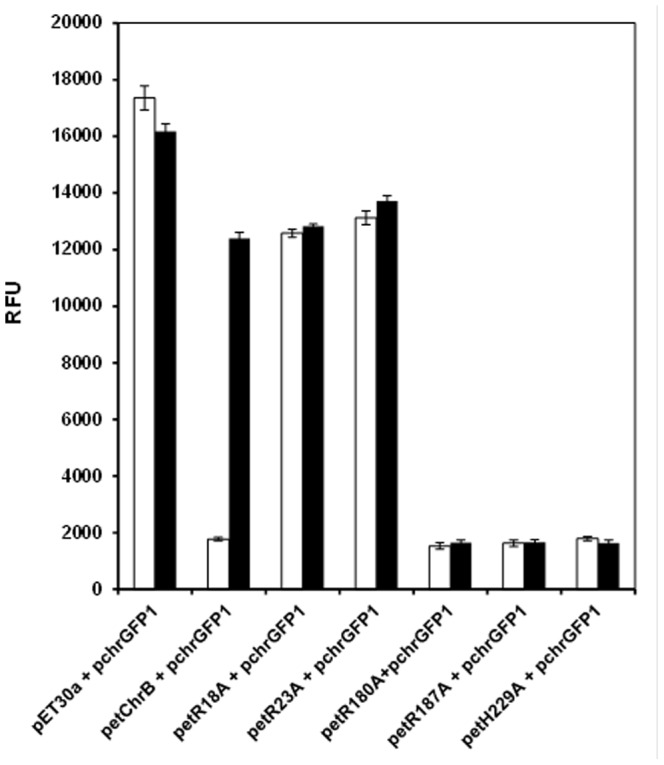
Figure 9. Fluorescence of E. coli BL21 co-transformed with two different plasmids (indicated in graphic).

Fluorescence was measured after 3(white bars) and with 10 µM (black bars) of chromate. The values represent averages and standard deviations of three replicates.
