
Figure 3. GLI1 expression in the validation cohort.
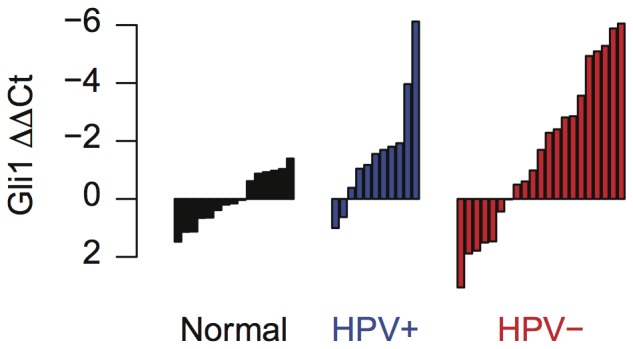
(a) GLI1 expression in validation cohort measured with RT-PCR.  values are computed relative to the mean
  count of for normal samples.
Official websites use .gov
A
.gov website belongs to an official
government organization in the United States.
Secure .gov websites use HTTPS
A lock (
) or https:// means you've safely
connected to the .gov website. Share sensitive
information only on official, secure websites.
(a) GLI1 expression in validation cohort measured with RT-PCR. values are computed relative to the mean count of for normal samples.