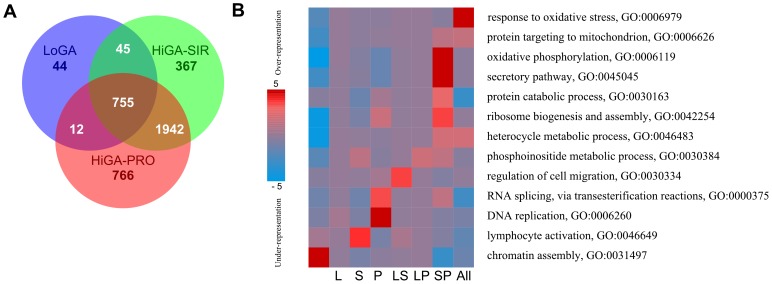
Figure 6. Overexpressed HE genes in the CAPs relative to normal GC B cells.
A) Venn diagram showing the intersections of the overexpressed HE genes (FDR <0.05) in each CAP relative to normal GC B cells. B) Enriched GO-terms from the category Biological Process according to an analysis with PAGE. The columns in the heatmap refer to the subsets of the venn diagram, e.g., column “L” refers to the genes which were uniquely overexpressed in LoGA (N = 44), “LS” to the genes which were overexpressed in LoGA and HiGA-SIR (N = 45), “SP” to the genes which were overexpressed in HiGA-SIR and HiGA-PRO and “All” to the genes commonly overexpressed in all the CAPs. The first column corresponds to the non-overexpressed genes (FDR >0.05). Rows correspond to GO terms. Red entries in the heatmap indicate overrepresentation of the GO-terms (measured by negative log10 p-values) while blue entries indicate underrepresentation (measured by log10 p-values).

