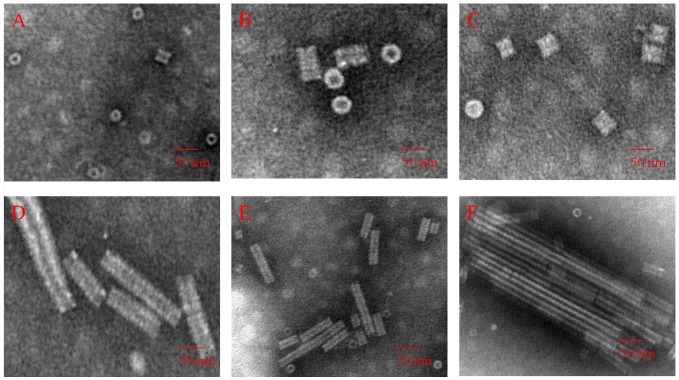
Figure 2. Characterization of the disk and helical stack height using TEM in 10 mM PB, 100 mM NaCl, pH 7.2 with increasing concentrations of protein, temperature and time.
As concentration, temperature and time increased, the dominant structure changed from disks to rods. (A) 1.8 mg/mL N-His-TMV CP19, 4°C, 10 h: monomers, dimers and disks. (B) 1.8 mg/mL N-His-TMV CP19, 20°C, 15 h: disks. (C) 1.8 mg/mL N-His-TMV CP19, 20°C, 20 h: disks. (D) 14 mg/mL N-His-TMV CP19, 20°C, 10 h: disks and rods. (E) 14 mg/mL N-His-TMV CP19, 20°C, 15 h: disks and rods. (F) 14 mg/mL N-His-TMV CP19, 20°C, 20 h: rods.

