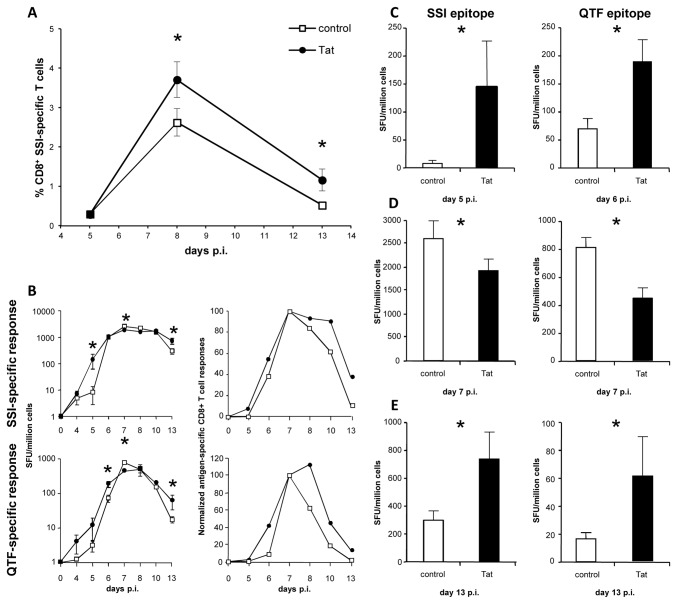
Figure 2. Tat modulates the kinetics and the magnitude of CTL responses.
Splenocytes were purified from control and Tat-treated HSV1-infected C57/BL6 mice at days 4, 5, 6, 7, 8, 10 and 13 post-infection. (A) Percentage of SSI-specific CD8+ T cells detected by dextramer staining. Data are presented as mean ± SEM of 5 mice per group. One representative experiment out of three is shown. (B) Kinetics of SSI- and QTF-specific cellular responses detected by IFNγ Elispot on fresh splenocytes. Data are presented as mean ± SEM of 5 mice per group (left panel). Expansion and contraction were normalized, for each group, to values detected at day 7 (right panel). One representative experiment out of three is shown. (C) SSI- and QTF- specific IFNγ responses at days 5 and 6 post-infection. (D) SSI- and QTF- specific IFNγ responses at day 7 post-infection. (E) SSI- and QTF-specific IFNγ responses at day 13 post-infection. For statistical analysis two-tailed Mann Whitney test was used. *P<0.05.

