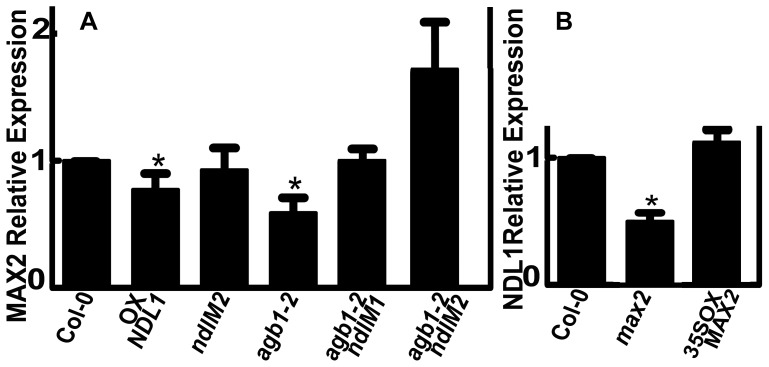
Figure 8. NDL and AGB1 expression affect relative MAX2 expression levels in flowers.
(A) qRT-PCR analysis to determine NDL- and AGB1-dependent relative MAX2 expression levels. (B) qRT-PCR analysis to determine MAX2-dependent NDL1 expression levels. Reactions were performed in triplicate, and three biological replicates were used. Error bars represent the SE. Student's t test results are based on differences between the wild type and the indicated genotypes and are shown as asterisks: *, P<0.05.

