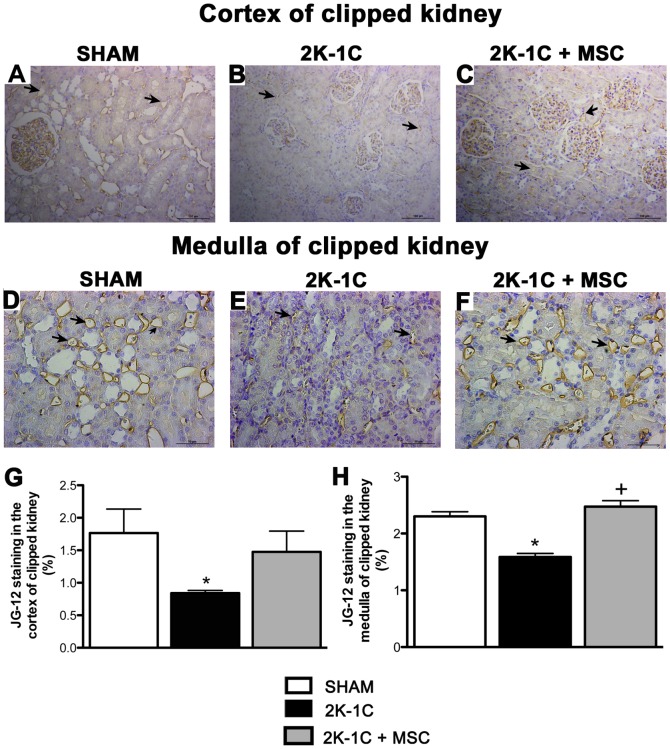
Figure 4. Capillary staining.
Representative image of JG-12 staining of a renal cortex (20x) and medulla (40X) of the clipped kidney of a SHAM (A and D), 2K-1C (B and E) and 2K-1C + MSC animal (C and F). Stained areas were measured using the Image Tool program (G and H). The arrows show the positive staining in the arterioles. *P<0.05 vs. SHAM. + P<0.05 vs. 2K-1C (One-way ANOVA followed by the Tukey’s post-test).

