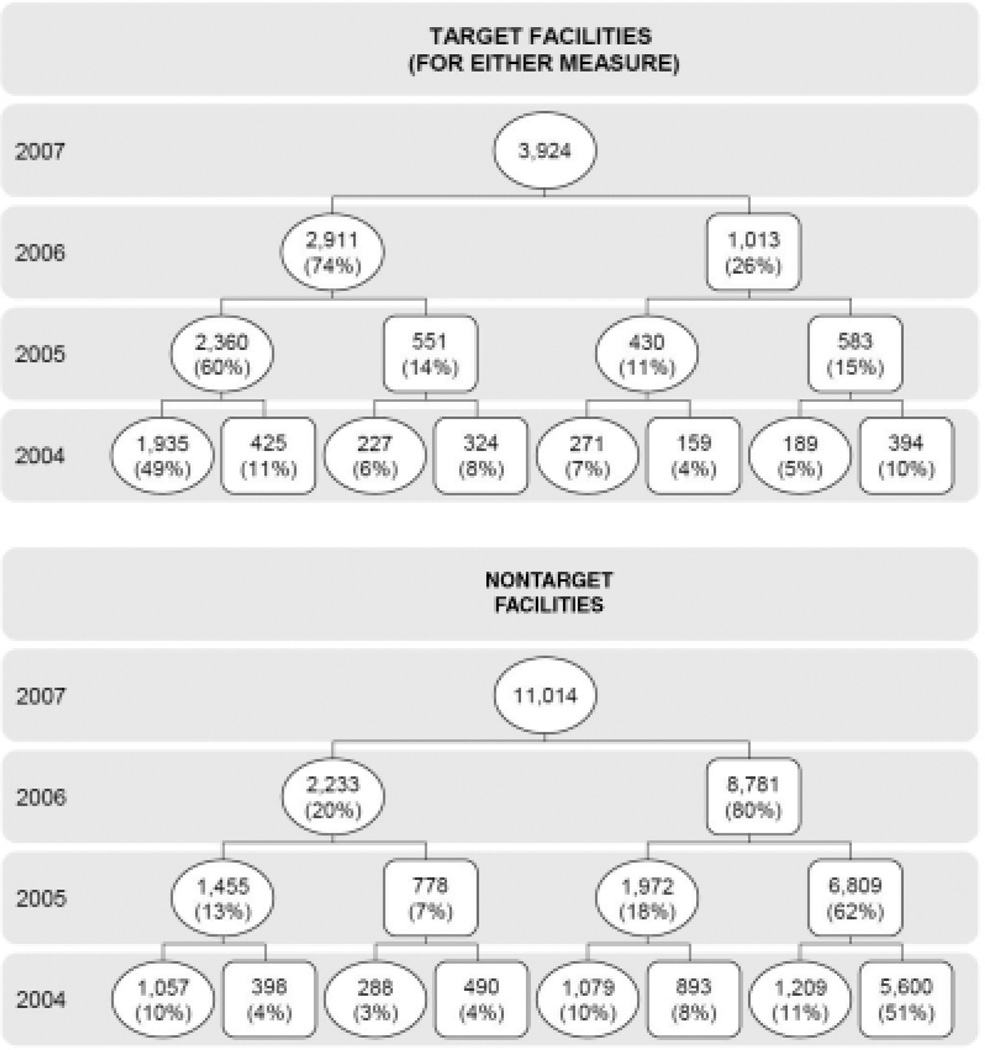
Figure 3.
Facilities’ hypothetical past Quality Improvement Organization target status, 2004–2007. The top panel begins with target facilities and looks back in time to assign what their target status would have been in previous years. The bottom panel begins with nontarget facilities and looks back over the same time period. Target status in previous years is defined based on the 2007 criteria (≥20% for pressure ulcers; ≥11% for restraints). Circles are target facilities, and squares are nontarget facilities. The nursing homes included are those that have all years of data from 2004 to 2007 (3,924 facilities are included in all analyses for target facility analyses, and 11,014 facilities are included in the nontarget facility analyses). The percentages for each row (year) may not add to 100% because of rounding.

